
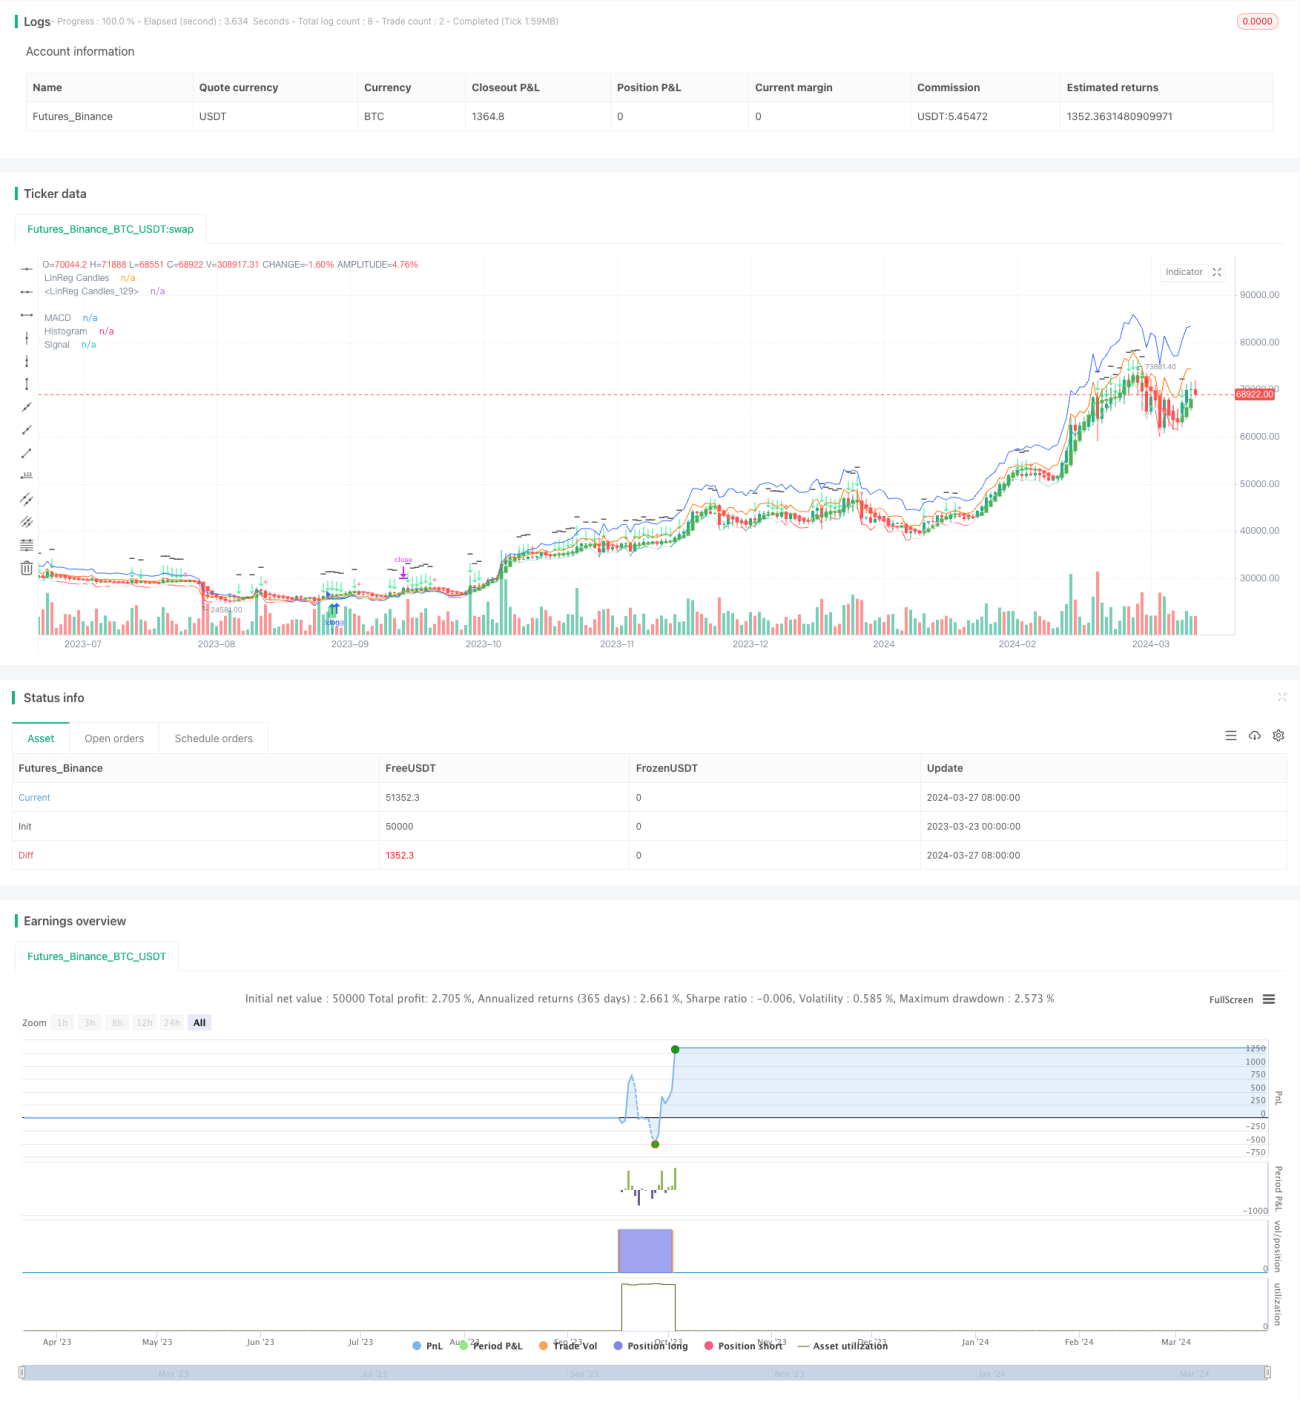
이 전략은 3차 지수 평균 이동선 ((Triple MACD) 과 상대적으로 강한 지수 ((RSI) 를 결합한 방법을 사용하여 1분 시간 주기 크리에이터 코스피 시장에 대한 수량 거래를 수행합니다. 전략의 주요 아이디어는 다른 주기 변수의 MACD 지수를 사용하여 시장의 다중 동적 변화를 캡처하고 RSI 지수를 사용하여 트렌드의 강도를 확인합니다. 3차 MACD 신호를 평균화함으로써 슬라이드 소음을 효과적으로 평형화하여 거래 신호의 신뢰성을 높일 수 있습니다.
이 전략은 3개의 다른 파라미터의 MACD 지표를 사용하며, 각각 5/13/34의 빠른 라인, 8/21/144의 느린 라인 사이클을 계산하여 그 사이의 차이를 계산하여 MACD 값을 얻는다. 그리고 이 3개의 MACD를 평균화하여, 평균 이후의 MACD 값을 빼고, 그것의 Signal 값을 얻는다. (즉, MACD의 주기 NEMA) 최종 MACD 기둥 도표를 얻는다. 14개의 주기의 RSI 지표를 계산하면서, 트렌드 강도를 판단하는데 도움을 준다.
이 전략은 세 번의 MACD와 RSI 지표를 교묘하게 결합하고, 선형 회귀 기술을 활용하여 수직 조정 상황을 인식하여 전체적인 고주파 수량 거래 전략을 형성한다. 전략의 엄격한 포지션 개시 조건과 평균 MACD 신호의 적용은 거래 정확도를 높이고 반전을 제어하는 데 도움이 된다. 전략은 일방적인 추세 상황에서 더 잘 작동하지만, 변동율 필터링을 도입하여 수직 조정 상황을 인식하는 방법을 최적화하고, 이동 스톱을 설정하고, 다양한 품종에 대한 독립적인 매개 변수를 설정하는 등의 조치를 통해 전략의 적응성과 안정성을 더욱 향상시킬 수 있습니다.
/*backtest
start: 2023-03-23 00:00:00
end: 2024-03-28 00:00:00
period: 1d
basePeriod: 1h
exchanges: [{"eid":"Futures_Binance","currency":"BTC_USDT"}]
*/
//@version=5
strategy(title="TrippleMACD", shorttitle="TrippleMACD + RSI strategy", format=format.price, precision=4, overlay=true)
// RSI
ma(source, length, type) =>
switch type
"SMA" => ta.sma(source, length)
"Bollinger Bands" => ta.sma(source, length)
"EMA" => ta.ema(source, length)
"SMMA (RMA)" => ta.rma(source, length)
"WMA" => ta.wma(source, length)
"VWMA" => ta.vwma(source, length)
rsiLengthInput = input.int(14, minval=1, title="RSI Length", group="RSI Settings")
rsiSourceInput = input.source(close, "Source", group="RSI Settings")
maTypeInput = input.string("SMA", title="MA Type", options=["SMA", "Bollinger Bands", "EMA", "SMMA (RMA)", "WMA", "VWMA"], group="MA Settings")
maLengthInput = input.int(14, title="MA Length", group="MA Settings")
bbMultInput = input.float(2.0, minval=0.001, maxval=50, title="BB StdDev", group="MA Settings")
showDivergence = input.bool(false, title="Show Divergence", group="RSI Settings")
up = ta.rma(math.max(ta.change(rsiSourceInput), 0), rsiLengthInput)
down = ta.rma(-math.min(ta.change(rsiSourceInput), 0), rsiLengthInput)
rsi = down == 0 ? 100 : up == 0 ? 0 : 100 - (100 / (1 + up / down))
rsiMA = ma(rsi, maLengthInput, maTypeInput)
isBB = maTypeInput == "Bollinger Bands"
bbUpperBand = plot(isBB ? rsiMA + ta.stdev(rsi, maLengthInput) * bbMultInput : na, title = "Upper Bollinger Band", color=color.green)
bbLowerBand = plot(isBB ? rsiMA - ta.stdev(rsi, maLengthInput) * bbMultInput : na, title = "Lower Bollinger Band", color=color.green)
// Divergence
lookbackRight = 5
lookbackLeft = 5
rangeUpper = 60
rangeLower = 5
bearColor = color.red
bullColor = color.green
textColor = color.white
noneColor = color.new(color.white, 100)
plFound = na(ta.pivotlow(rsi, lookbackLeft, lookbackRight)) ? false : true
phFound = na(ta.pivothigh(rsi, lookbackLeft, lookbackRight)) ? false : true
_inRange(cond) =>
bars = ta.barssince(cond == true)
rangeLower <= bars and bars <= rangeUpper
//------------------------------------------------------------------------------
// Regular Bullish
// rsi: Higher Low
rsiHL = rsi[lookbackRight] > ta.valuewhen(plFound, rsi[lookbackRight], 1) and _inRange(plFound[1])
// Price: Lower Low
priceLL = low[lookbackRight] < ta.valuewhen(plFound, low[lookbackRight], 1)
bullCondAlert = priceLL and rsiHL and plFound
bullCond = showDivergence and bullCondAlert
// rsi: Lower High
rsiLH = rsi[lookbackRight] < ta.valuewhen(phFound, rsi[lookbackRight], 1) and _inRange(phFound[1])
// Price: Higher High
priceHH = high[lookbackRight] > ta.valuewhen(phFound, high[lookbackRight], 1)
bearCondAlert = priceHH and rsiLH and phFound
bearCond = showDivergence and bearCondAlert
// Getting inputs
stopLuse = input(1.040)
fast_length = input(title = "Fast Length", defval = 5)
slow_length = input(title = "Slow Length", defval = 8)
fast_length2 = input(title = "Fast Length2", defval = 13)
slow_length2 = input(title = "Slow Length2", defval = 21)
fast_length3 = input(title = "Fast Length3", defval = 34)
slow_length3 = input(title = "Slow Length3", defval = 144)
fast_length4 = input(title = "Fast Length3", defval = 68)
slow_length4 = input(title = "Slow Length3", defval = 288)
src = input(title = "Source", defval = close)
signal_length2 = input.int(title="Signal Smoothing", minval = 1, maxval = 200, defval = 11)
signal_length = input.int(title = "Signal Smoothing", minval = 1, maxval = 50, defval = 9)
sma_source = input.string(title = "Oscillator MA Type", defval = "EMA", options = ["SMA", "EMA"])
sma_signal = input.string(title = "Signal Line MA Type", defval = "EMA", options = ["SMA", "EMA"])
// Calculating
fast_ma = sma_source == "SMA" ? ta.sma(src, fast_length) : ta.ema(src, fast_length)
slow_ma = sma_source == "SMA" ? ta.sma(src, slow_length) : ta.ema(src, slow_length)
fast_ma2 = sma_source == "SMA2" ? ta.sma(src, fast_length2) : ta.ema(src, fast_length2)
slow_ma2 = sma_source == "SMA2" ? ta.sma(src, slow_length2) : ta.ema(src, slow_length2)
fast_ma3 = sma_source == "SMA3" ? ta.sma(src, fast_length3) : ta.ema(src, fast_length3)
slow_ma3 = sma_source == "SMA3" ? ta.sma(src, slow_length3) : ta.ema(src, slow_length3)
fast_ma4 = sma_source == "SMA3" ? ta.sma(src, fast_length3) : ta.ema(src, fast_length3)
slow_ma4 = sma_source == "SMA3" ? ta.sma(src, slow_length3) : ta.ema(src, slow_length3)
macd = fast_ma - slow_ma
macd2 = fast_ma2 - slow_ma2
macd3 = fast_ma3 - slow_ma3
macd4 = fast_ma4 - slow_ma4
signal = sma_signal == "SMA" ? ta.sma(macd, signal_length) : ta.ema(macd, signal_length)
signal2 = sma_signal == "SMA" ? ta.sma(macd2, signal_length) : ta.ema(macd2, signal_length)
signal3 = sma_signal == "SMA" ? ta.sma(macd3, signal_length) : ta.ema(macd3, signal_length)
signal4 = sma_signal == "SMA" ? ta.sma(macd4, signal_length) : ta.ema(macd4, signal_length)
//hist = (macd + macd2 + macd3)/1 - (signal + signal2 + signal3)/1
hist = (macd + macd2 + macd3 + macd4)/4 - (signal + signal2 + signal3 + signal4)/4
signal5 = (signal + signal2 + signal3)/3
sma_signal2 = input.bool(title="Simple MA (Signal Line)", defval=true)
lin_reg = input.bool(title="Lin Reg", defval=true)
linreg_length = input.int(title="Linear Regression Length", minval = 1, maxval = 200, defval = 11)
bopen = lin_reg ? ta.linreg(open, linreg_length, 0) : open
bhigh = lin_reg ? ta.linreg(high, linreg_length, 0) : high
blow = lin_reg ? ta.linreg(low, linreg_length, 0) : low
bclose = lin_reg ? ta.linreg(close, linreg_length, 0) : close
shadow = (bhigh - bclose) + (bopen - blow)
body = bclose - bopen
perc = (shadow/body)
cond2 = perc >=2 and bclose+bclose[1]/2 > bopen+bopen[1]/2
r = bopen < bclose
//signal5 = sma_signal2 ? ta.sma(bclose, signal_length) : ta.ema(bclose, signal_length)
plotcandle(r ? bopen : na, r ? bhigh : na, r ? blow: na, r ? bclose : na, title="LinReg Candles", color= color.green, wickcolor=color.green, bordercolor=color.green, editable= true)
plotcandle(r ? na : bopen, r ? na : bhigh, r ? na : blow, r ? na : bclose, title="LinReg Candles", color=color.red, wickcolor=color.red, bordercolor=color.red, editable= true)
//alertcondition(hist[1] >= 0 and hist < 0, title = 'Rising to falling', message = 'The MACD histogram switched from a rising to falling state')
//alertcondition(hist[1] <= 0 and hist > 0, title = 'Falling to rising', message = 'The MACD histogram switched from a falling to rising state')
green = hist >= 0 ? (hist[1] < hist ? "G" : "GL") : (hist[1] < hist ? "RL" : "R")
Buy = green == "G" and green[1] != "G" and green[1] != "GL" and bopen < bclose and rsi < 55.0 //and not cond2
//StopBuy = (green == "R" or green == "RL" or green == "RL") and bopen > bclose and bopen[1] < bclose[1]
StopBuy = bopen > bclose and bopen[1] < bclose[1] and (green == "G" or green == "GL" or green == "R") and bopen[2] < bclose[2] and bopen[3] < bclose[3]
hists = close[3] < close[2] and close[2] < close[1]
//Buy = green == "RL" and hist[0] > -0.07 and hist[0] < 0.00 and rsi < 55.0 and hists
//StopBuy = green == "GL" or green == "R"
alertcondition(Buy, "Long","Покупка в лонг")
alertcondition(StopBuy, "StopLong","Закрытие сделки")
//hline(0, "Zero Line", color = color.new(#787B86, 50))
plot(hist + (close - (close * 0.03)), title = "Histogram", style = plot.style_line, color = (hist >= 0 ? (hist[1] < hist ? #26A69A : #B2DFDB) : (hist[1] < hist ? #FFCDD2 : #FF5252)))
plotshape(Buy ? low : na, 'Buy', shape.labelup, location.belowbar , color=color.new(#0abe40, 50), size=size.small, offset=0)
plotshape(StopBuy ? low : na, 'Buy', shape.cross, location.abovebar , color=color.new(#be0a0a, 50), size=size.small, offset=0)
plot(macd4 + (close - (close * 0.01)), title = "MACD", color = #2962FF)
plot(signal5 + (close - (close * 0.01)), title = "Signal", color = #FF6D00)
plotchar(cond2 , char='↓', color = color.rgb(0, 230, 119), text = "-")
if (Buy)
strategy.entry("long", strategy.long)
// if (startShortTrade)
// strategy.entry("short", strategy.short)
profitTarget = strategy.position_avg_price * stopLuse
strategy.exit("Take Profit", "long", limit=profitTarget)
// strategy.exit("Take Profit", "short", limit=profitTarget)