Breakout 최고가 EMA 크로스오버 전략

개요
최상위 EMA 교차 전략은 가격 교차와 지수 이동 평균 (EMA) 의 교차를 기반으로 한 거래 전략이다. 이 전략은 지정된 주기 내의 최고 가격을 구매 신호로, EMA를 판매 신호로 사용한다. 상장 가격이 지정된 주기 내의 최고 가격을 돌파할 때, 전략은 구매 신호를 발생시킨다. 상장 가격이 EMA를 넘어서는 경우, 전략은 판매 신호를 발생시킨다. 이 전략은 또한 위험을 제어하기 위해 중지 가격을 설정한다.
전략 원칙
최고 가격을 돌파하는 EMA 교차 전략의 핵심 원칙은 가격 돌파와 EMA 교차를 사용하여 시장 추세를 포착하는 것입니다. 가격이 지정된 기간의 최고 가격을 돌파하면 시장이 상승 추세에 들어갈 수 있음을 나타냅니다. 따라서 전략은 구매 신호를 발생시킵니다. 동시에, EMA는 추세를 추적하는 지표로서 가격이 EMA를 넘어서는 경우 상승 추세가 끝날 수 있음을 나타냅니다. 따라서 전략은 판매 신호를 발생시킵니다.
이 전략은 다음과 같은 단계를 통해 거래가 이루어집니다.
- 지정된 주기 내의 최고 가격을 돌파구 구매 가격으로 계산한다.
- 판매 신호로 EMA를 계산하십시오.
- 종식 가격이 구매 가격을 돌파했을 때, 현재 포지션이 없다면, 전략은 구매 신호를 생성한다.
- 마감 가격이 EMA를 넘어갈 때, 현재 지분을 가지고 있다면, 전략은 판매 신호를 발생시킨다.
- 정해진 주기 내의 최저 가격을 스톱 로즈 가격으로 계산한다.
- 만약 가격이 스톱로스 가격을 넘어간다면, 전략은 즉각적으로 청산된다.
위와 같은 단계를 통해, 이 전략은 시장의 상승 추세에서 이익을 얻을 수 있으며, 동시에 하향 위험을 제어하기 위해 스톱로스를 사용할 수 있습니다.
전략적 이점
가장 높은 EMA를 돌파하는 교차 전략은 다음과 같은 장점이 있습니다.
- 트렌드 추적: 이 전략은 가격 돌파구와 EMA 교차를 사용하여 시장의 추세를 포착하여 상승 추세에서 이익을 얻을 수 있습니다.
- 위험 제어: 이 전략은 스톱로스 가격을 사용하여 하향 위험을 제어하여 전략의 최대 회수량을 효과적으로 줄일 수 있다.
- 매개 변수 유연성: 이 전략은 주기, 리스크 비율, 스톱로드 사용 여부와 같은 사용자 사용자 정의 가능한 여러 매개 변수를 제공하며, 다른 거래 스타일과 시장 환경에 따라 조정할 수 있습니다.
- 간단하고 효과적입니다. 이 전략의 논리는 간단하고 명확하며, 이해하기 쉽고, 실행할 수 있으며, 트렌드 시장에서 좋은 수익을 얻을 수 있습니다.
전략적 위험
최상위 EMA를 돌파하는 EMA 교차 전략에는 장점이 있지만 다음과 같은 위험도 있습니다.
- 시장의 변동 위험: 시장의 변동이 큰 상황에서, 이 전략은 더 많은 가짜 신호를 생성할 수 있으며, 이로 인해 자주 거래와 자금 손실이 발생할 수 있다.
- 트렌드 리버팅 위험: 시장의 트렌드가 변할 때, 이 전략은 판매를 지연시킬 수 있으며, 이로 인해 이익이 반전되거나 손실이 손실로 전환될 수 있다.
- 매개 변수 설정 위험: 이 전략의 성능은 매개 변수 설정, 예를 들어 주기, 위험 비율 등에 의존한다. 매개 변수 설정이 부적절하면, 전략의 성능이 좋지 않을 수 있다.
이러한 위험을 완화하기 위해 다음과 같은 조치를 고려할 수 있습니다.
- 적절한 조정 파라미터: 다른 시장 환경과 거래 유형에 따라 잘못된 신호와 빈 거래를 줄이기 위해 주기 확대, 위험 비율을 낮추는 것과 같은 전략 파라미터를 적절하게 조정하십시오.
- 다른 지표와 결합: 트렌드 및 신호의 유효성을 확인하고 전략의 신뢰성을 높이기 위해 RSI, MACD 등과 같은 다른 기술 지표와 결합 할 수 있습니다.
- 합리적인 스톱: 합리적인 스톱 가격을 설정하여 하향 위험을 통제하고 수익 기회를 놓치지 않도록 조기 중단하지 않습니다.
전략 최적화 방향
최고 가격 EMA 교차 전략의 성능을 더욱 향상시키기 위해 다음과 같은 최적화 방향을 고려할 수 있습니다.
- 동적 조정 파라미터: 시장의 변동성과 트렌드 강도에 따라, 동적으로 조정 전략 파라미터, 예를 들어 변동성이 큰 경우 주기를 늘리고, 트렌드가 강한 경우 위험 비율을 높여서, 다른 시장 환경에 적응하기 위해.
- 다중 포지션 메커니즘을 도입: 기존의 다중 포지션 거래 기반에 포지션 거래 메커니즘을 도입하여 하향 추세에서도 이익을 얻을 수 있으며, 전략의 적응성과 수익성을 향상시킬 수 있습니다.
- 스톱 및 스톱을 최적화: 이동 스톱, 부분 스톱 등의 방법을 사용하여 위험을 더 잘 제어하고 수익을 고정하는 등 스톱 및 스톱의 설정을 최적화하십시오.
- 기본적 분석과 결합: 기본적 분석과 기술적 분석을 결합하여, 기업의 수익 보고서, 경제 데이터 발표와 같은 중요한 이벤트 이전에 전략의 위치와 매개 변수를 조정하여, 가능한 시장 변화에 대응한다.
이러한 최적화 조치는 최고 가격 EMA 교차 전략의 안정성, 적응성 및 수익성을 향상시킬 수 있으며, 이를 통해 더 많은 시장 환경에서 좋은 성과를 낼 수 있습니다.
요약하다
최상위 가격 EMA 교차 전략은 가격 교차와 EMA 교차를 활용하여 시장의 추세를 포착하고 동시에 스톱로스를 사용하여 하향 위험을 제어하는 간단한 효과적 인 트렌드 추적 전략입니다. 이 전략의 논리는 명확하고, 매개 변수는 유연하며, 이해하기 쉽고 구현 할 수 있습니다. 이 전략에는 시장의 변동 위험, 추세 전환 위험 및 매개 변수 설정 위험과 같은 특정 위험이 있지만, 적절한 위험 제어 조치를 통해 이러한 위험을 완화 할 수 있습니다.
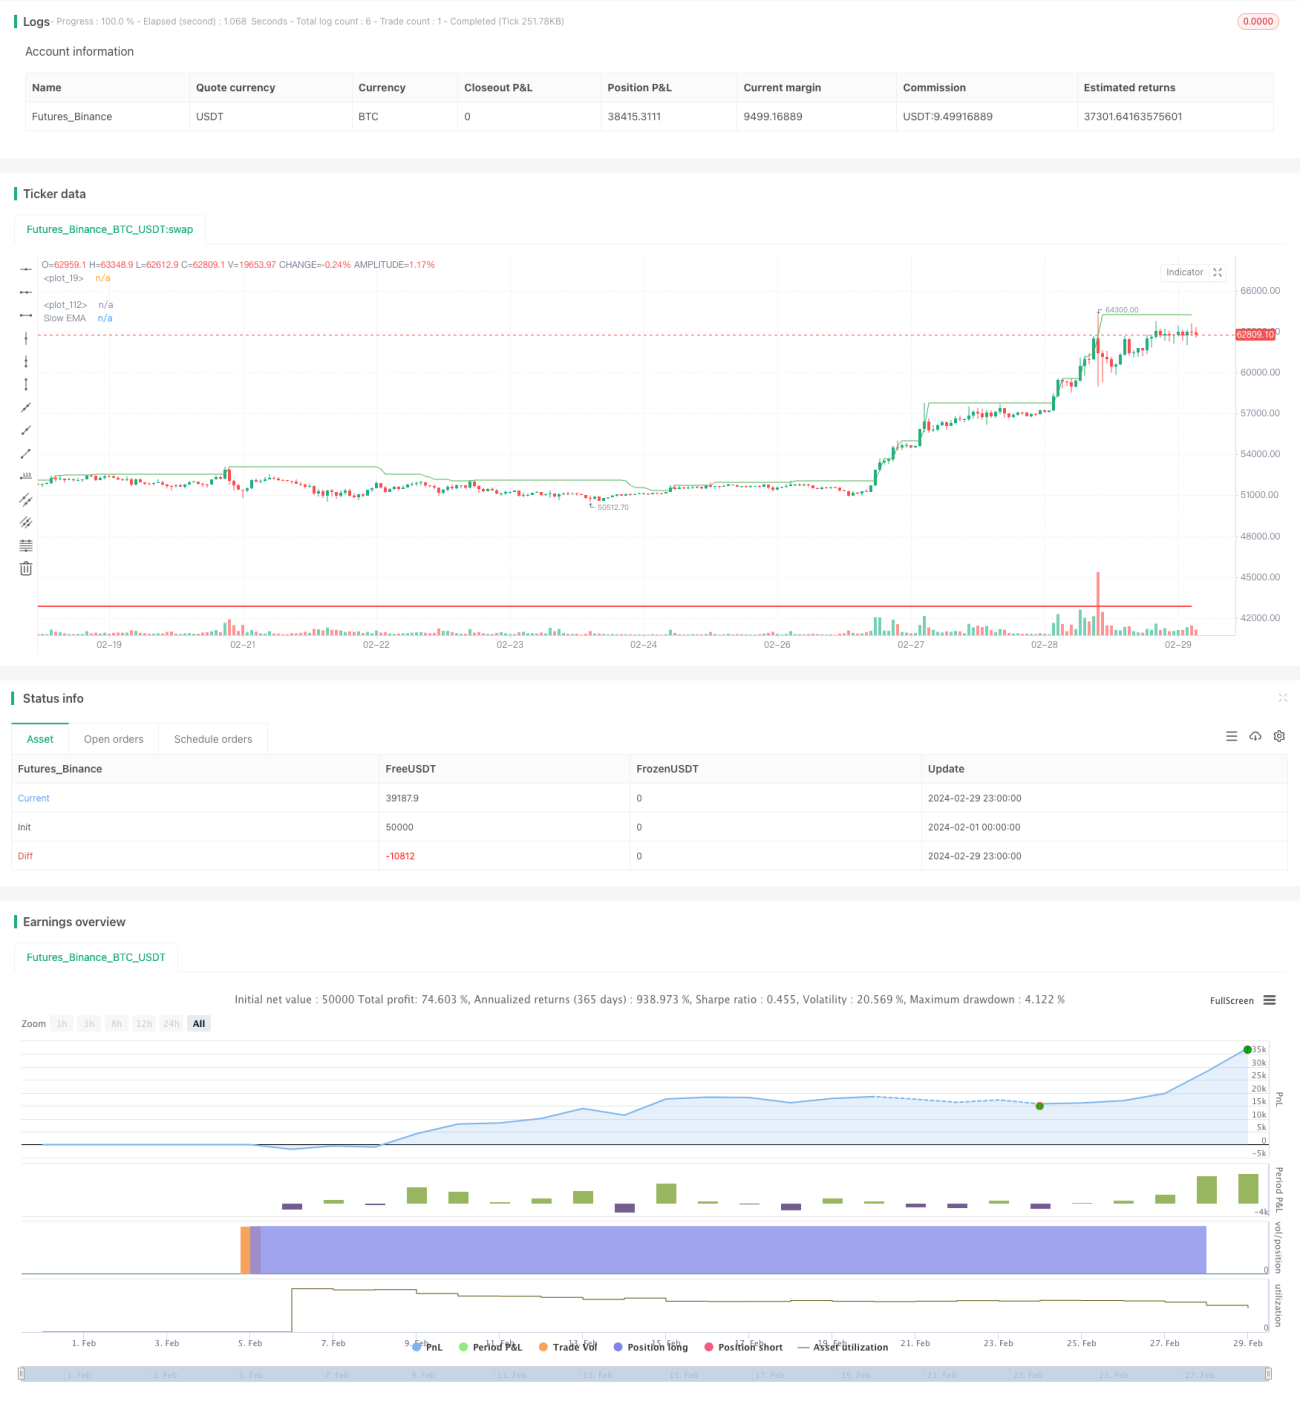
/*backtest
start: 2024-02-01 00:00:00
end: 2024-02-29 23:59:59
period: 1h
basePeriod: 15m
exchanges: [{"eid":"Futures_Binance","currency":"BTC_USDT"}]
*/

// @version = 5
strategy(title="BreakHigh Strategy", overlay=true)
Period = input.int(34, "Number of previous bars(34,52 Recommend)")
showbg = input(defval = false,title = "Show BackGround Color")- 1