벡터 캔들스틱 차트를 기반으로 한 채널 브레이크아웃 및 맞춤형 ChoCH 전략

1
Follow
1782
Followers
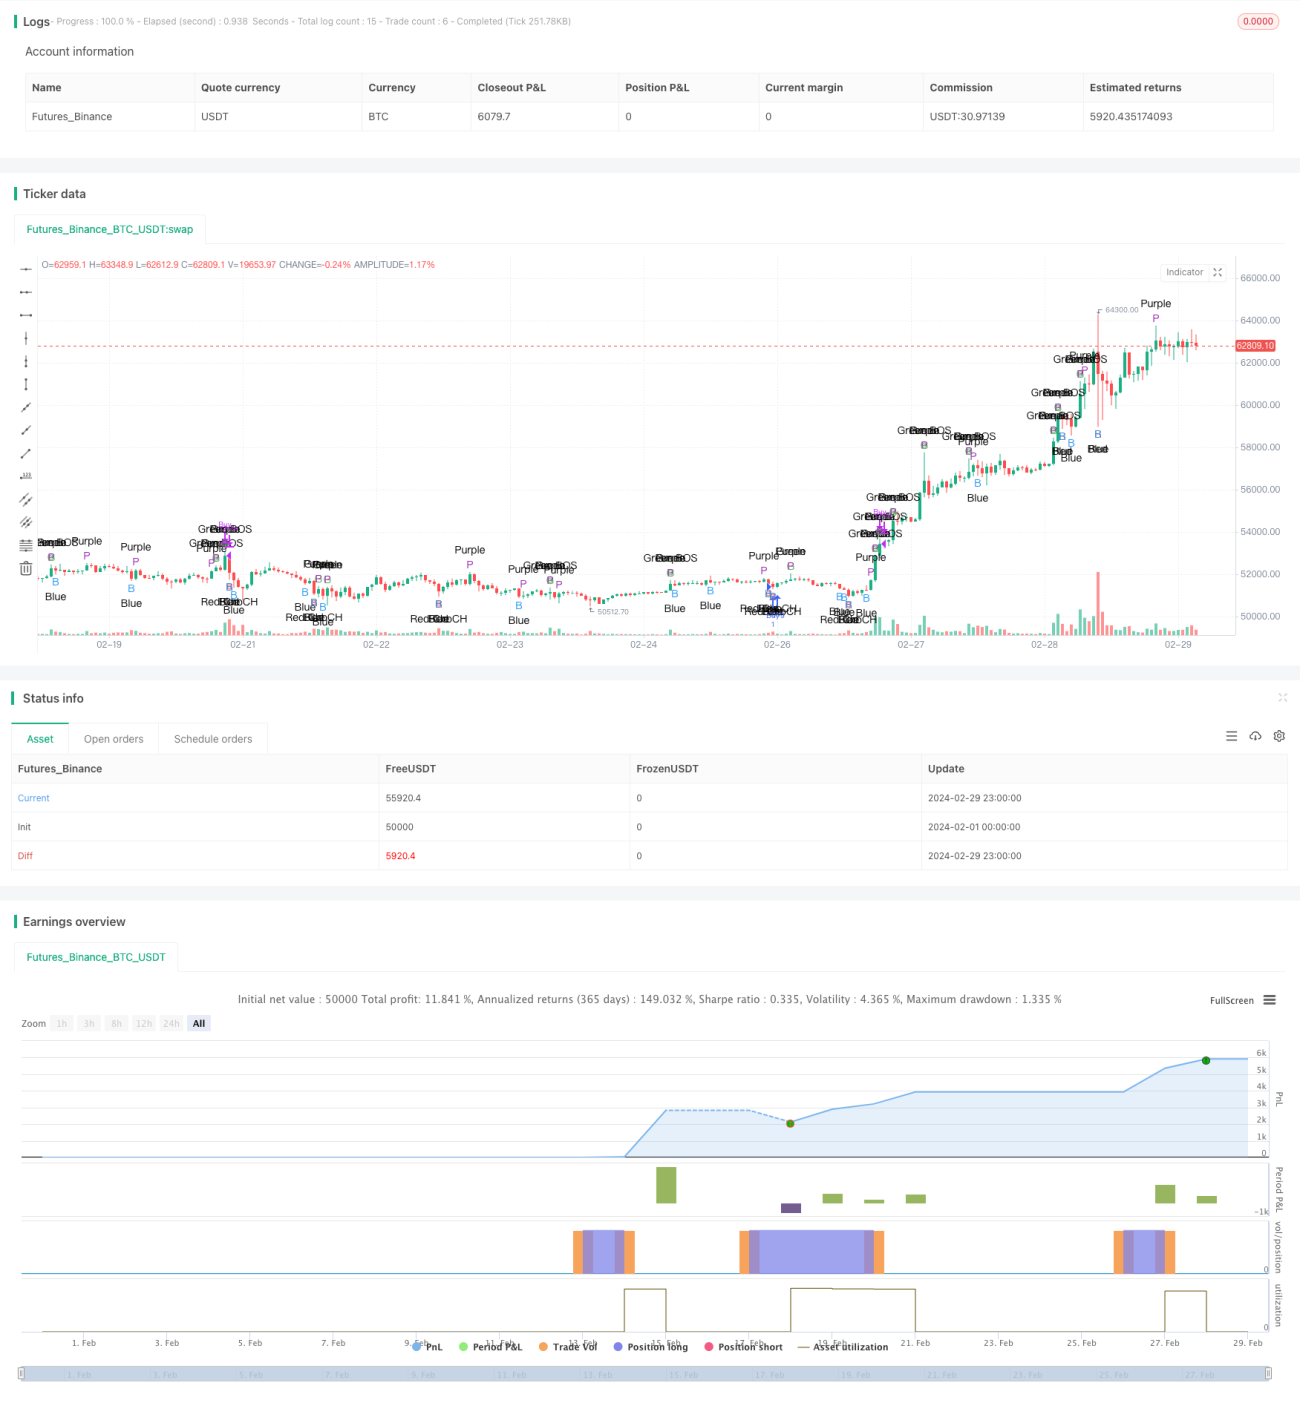
개요
이 전략은 벡터 <unk> (Vector Candles) 의 개념을 전통적인 채널 브레이크 (Channel Breakout) 와 초콜릿 소스 (Chocolate Sauce, ChoCH) 모형의 인식과 결합하여 시장의 돌파행위를 포착하는 것을 목표로 한다. 전략은 상가 가격과 전 K 선의 높낮이를 비교하여 신호를 확인하고, 합성 교역을 확대하는 벡터 <unk> (Vector Candles) 을 결합하여 소음을 필터링하는 데 사용하며, 특정 수의 확인 K 선을 사용합니다.
전략 원칙
- 과거 일정 수의 K 선의 평균 교류량을 계산하고 교류량을 확대하는 배수를 기준으로 네 가지 다른 색 (붉은, 녹색, 파란색, 보라색) 을 정의하는 벡터 도표.
- 클로즈 가격이 이전 K선 하위점보다 낮고 빨간색 벡터 필터링으로 표시되면 빨간색 ChoCH 신호로 식별됩니다. 클로즈 가격이 이전 K선 하위점보다 높고 녹색 벡터 필터링으로 표시되면 녹색 BOS 신호로 식별됩니다.
- 특정 수의 확인 K 라인 내에서, 빨간 벡터<unk>그램이 설정된 <unk>값에 도달하는 경우, 빨간 ChoCH 신호를 확인한다. 녹색 벡터<unk>그램이 설정된 <unk>값에 도달하는 경우, 녹색 BOS 신호를 확인한다.
- 빨간색 ChoCH 신호를 확인했을 때 더 많은 포즈를 취하고, 녹색 BOS 신호를 확인했을 때 더 적은 포즈를 취한다.
전략적 이점
- 벡터 필터 지도와 전통적인 채널 브레이크 및 ChoCH 모드를 결합하여 신호의 신뢰도를 높였다.
- 확인 K선 메커니즘을 도입하여, 노이즈와 가짜 신호를 효과적으로 필터링한다.
- 벡터 필터의 색깔을 구분하여 신호를 더 직관적이고 쉽게 식별할 수 있도록 한다.
- 매개 변수는 조정 가능하며, 다양한 시장 환경과 거래 스타일에 따라 최적화 될 수 있습니다.
전략적 위험
- 불안한 시장에서, 자주 돌파와 후퇴는 전략이 더 많은 가짜 신호와 손실 거래로 이어질 수 있다.
- 확인 K 라인의 수를 잘못 설정하면 신호가 지연되거나 초기에 들어오게 될 수 있다.
- 기술적인 지표에만 의존하여 기본적인 요소를 무시하면 예상치 못한 위험에 처할 수 있습니다.
- 이 전략은 스톱로드를 설정하지 않았으며, 급격한 시장변동이 발생할 경우 큰 손실을 입을 수 있다.
전략 최적화 방향
- 이동 평균과 같은 트렌드 확인 지표를 도입하여 브레이크 신호가 발생한 후 트렌드 방향을 확인하고 신호 품질을 향상시킵니다.
- 흔들리는 시장의 경우, 통로 내부에 오버 및 오브 시드 트리거를 설정하는 것과 같은 범위 거래 전략을 도입하는 것이 고려될 수 있습니다.
- 확인 K 선의 수를 최적화하여 적절한 균형 지점을 찾아서 노이스를 효과적으로 필터링하면서도 너무 많이 지연되지 않습니다.
- 합리적인 스톱 로즈와 스톱 스톱 규칙을 설정하고, 단일 거래 위험과 전체 철수를 제어합니다.
- 다른 기술 지표 또는 시장 감정 지표와 결합하면 더 많은 거래 의사 결정 기반을 제공합니다.
요약하다
이 전략은 혁신적인 방법으로 벡터 필터링과 고전적인 채널 브레이크 및 ChoCH 모드를 결합하여 색상 분화 및 확인 K선 메커니즘을 통해 신호의 신뢰도 및 식별도를 향상시킵니다. 전략의 장점은 규칙이 명확하고 신호가 직관적이며 약간의 유연성 및 최적화 할 수있는 공간입니다. 그러나 전략에는 약간의 제한과 위험이 있습니다.
Source
Pine
Strategy parameters
Related strategies
Comment
All comments (0)
No data
- 1