개요
이 전략은 수정된 상대적으로 약한 지수 (Modified RSI) 를 기반으로 시장의 추세를 포착한다. 전략의 주요 아이디어는 수정된 RSI 지표의 교차 신호와 직선 그래프 신호를 사용하여 시장의 추세를 판단하고 트렌드 방향에 따라 거래하는 것이다.
전략 원칙
- 가격의 EMA를 Modified RSI의 입력으로 계산합니다.
- 수정된 RSI를 계산합니다.
- 수정된 RSI의 EMA를 신호선으로 계산합니다.
- 수정된 RSI와 신호선의 차이를 직사각형으로 계산합니다.
- Modified RSI 상에서 신호선을 통과하고 직사각형이 0보다 크면 구매 신호가 발생
- Modified RSI 아래의 신호선을 통과하고 직사각형이 0보다 작으면 판매 신호를 생성합니다
전략적 이점
- Modified RSI는 전통적인 RSI에 비해 트렌드를 더 잘 포착합니다.
- Modified RSI의 크로스 신호와 직각 그래프 신호를 결합하여 가짜 신호를 효과적으로 필터링 할 수 있습니다.
- 다른 시장과 주기에 맞는 변수 조정
- 간단하고 계산 효율이 높습니다.
전략적 위험
- 수정된 RSI 지표는 흔들리는 시장에서 잘못된 신호를 유발할 수 있습니다.
- 트렌드 전환점 포착이 늦어질 수 있다
- 단일 지표는 가격 소음으로 방해받습니다.
전략 최적화 방향
- 이동 평균과 같은 다른 추세 지표와 결합하여 신호의 신뢰성을 높일 수 있습니다.
- 단편 거래 위험을 제어하기 위해 Stop Loss Stop Module를 추가할 수 있습니다.
- 다른 시장 특성에 따라 최적화 가능한 매개 변수
- 포지션 관리 모듈에 추가하여 포지션을 동적으로 조정할 수 있습니다.
요약하다
이 전략은 Modified RSI 지표의 특성을 활용하여 트렌드 추적의 관점에서 거래 시스템을 구축한다. Modified RSI 지표는 전통적인 RSI 지표의 일부 결점을 극복하고, 트렌드 캡처 능력이 상대적으로 강하다. 그러나 단일 지표의 전략은 종종 한계가 있으며, 다른 기술 수단과 결합하여 개선해야 한다.
전략 소스 코드
/*backtest
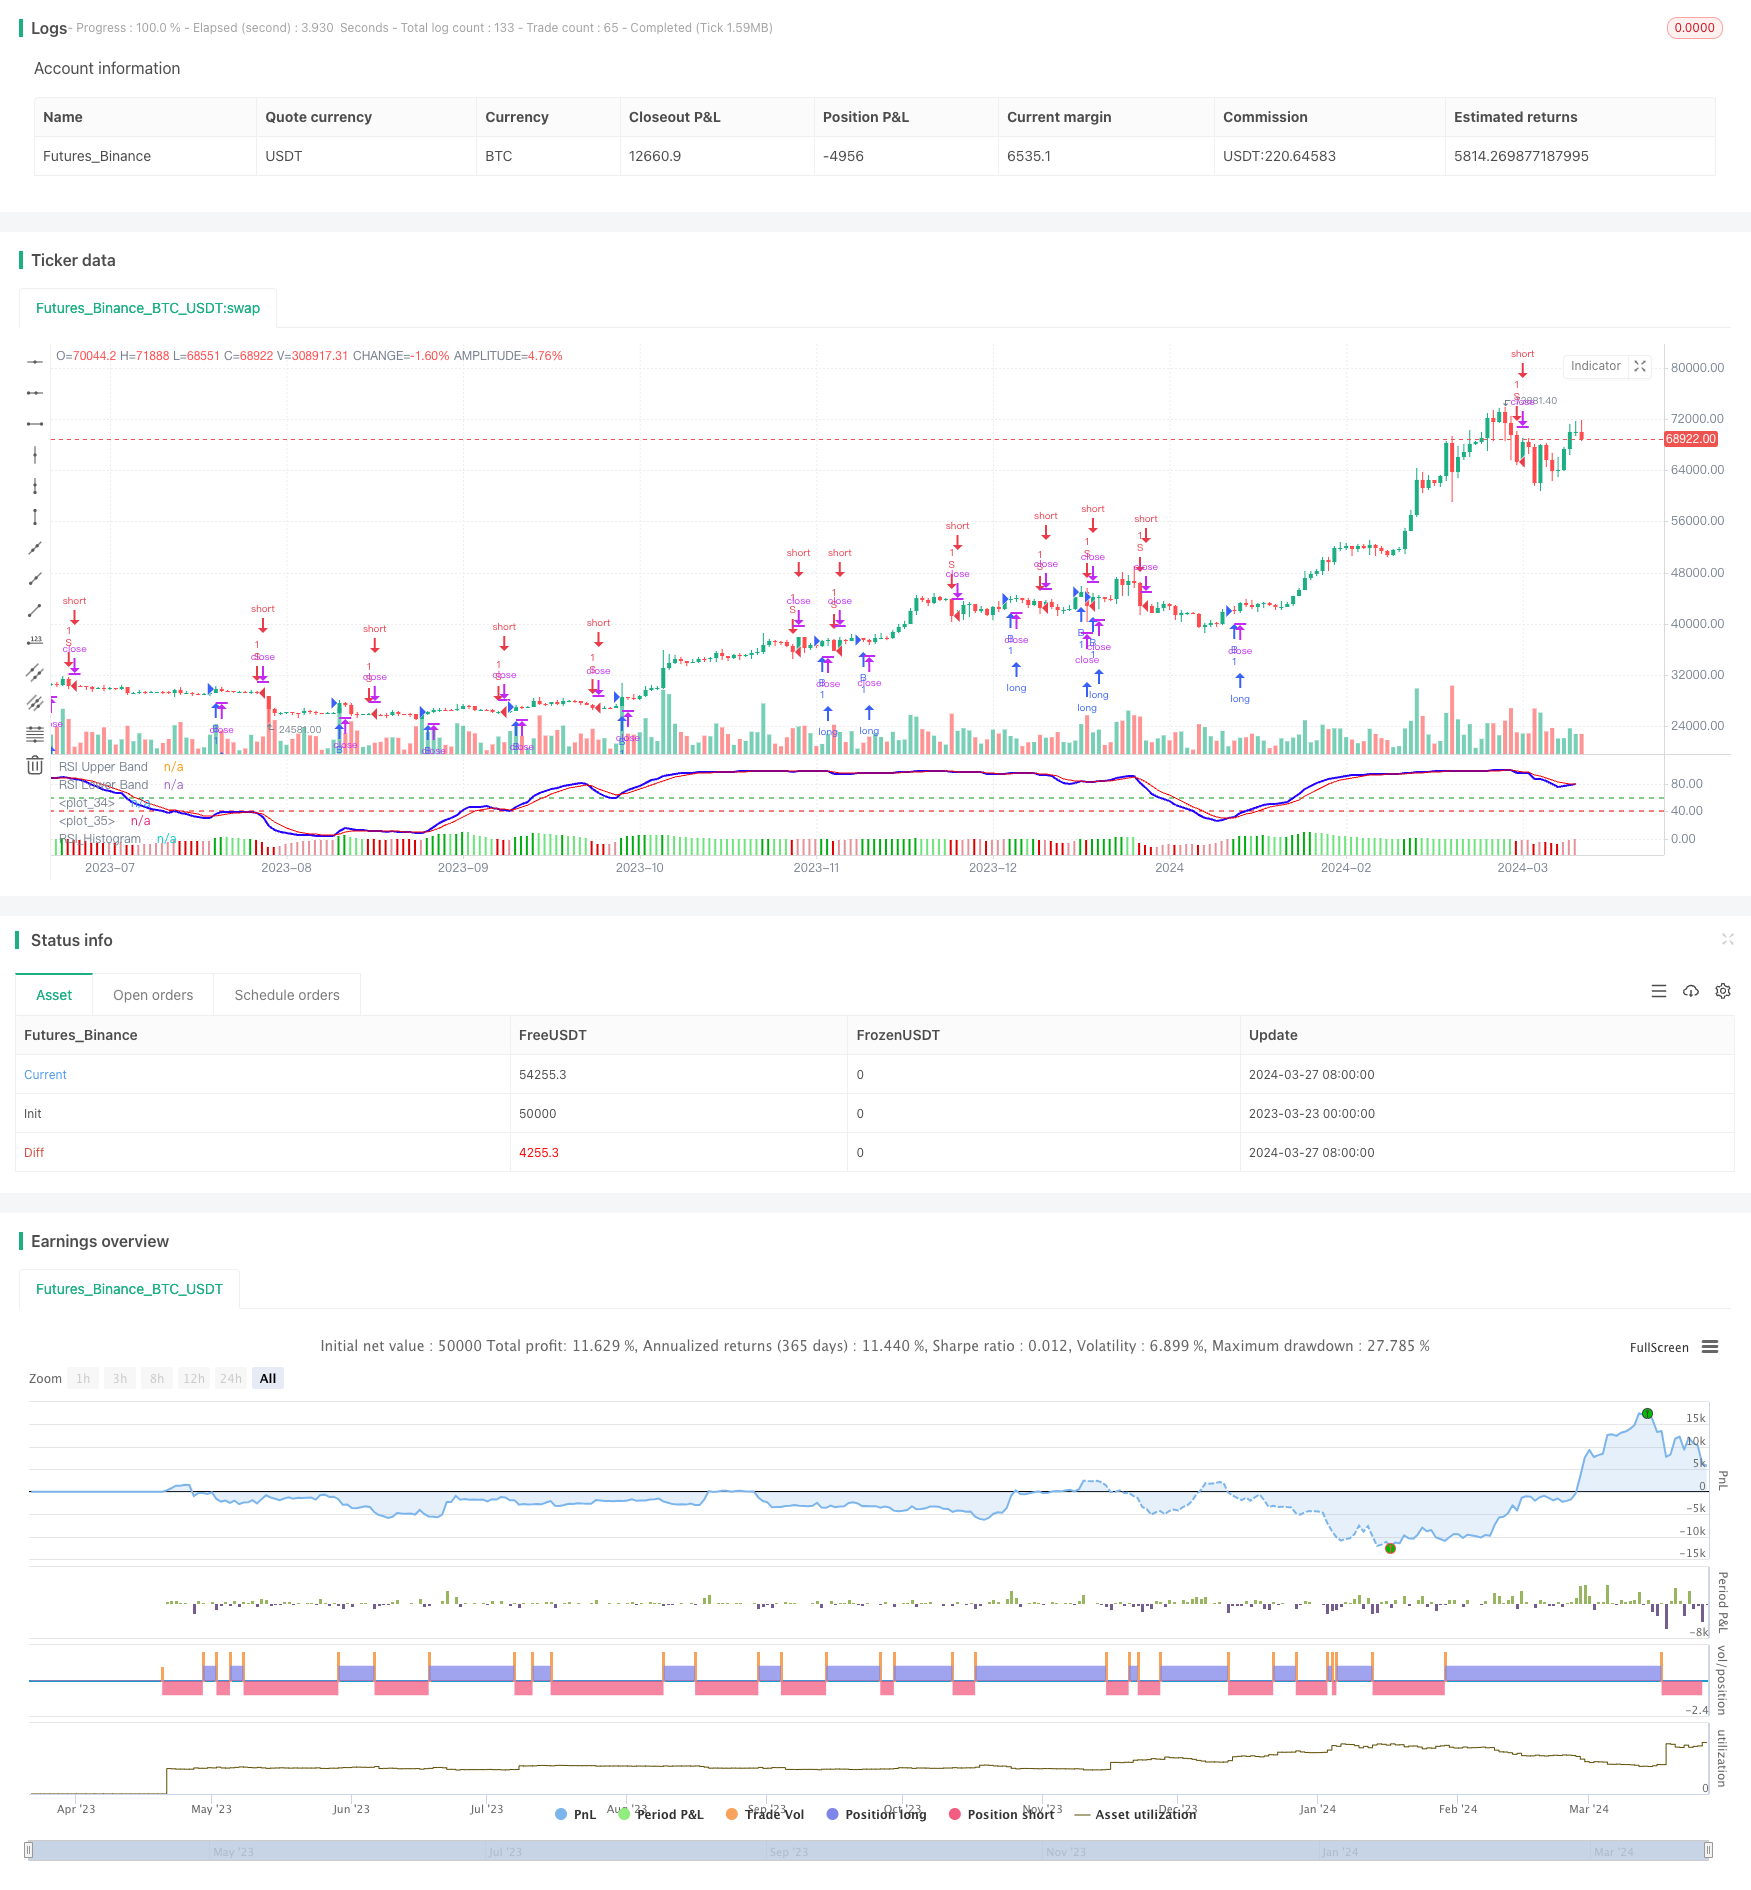
start: 2023-03-23 00:00:00
end: 2024-03-28 00:00:00
period: 1d
basePeriod: 1h
exchanges: [{"eid":"Futures_Binance","currency":"BTC_USDT"}]
*/
// This source code is subject to the terms of the Mozilla Public License 2.0 at https://mozilla.org/MPL/2.0/
// © YogirajDange
//@version=5
// Verical lines
// // Define the times
// t1 = timestamp(year, month, dayofmonth, 09, 15) // 9:15
// t2 = timestamp(year, month, dayofmonth, 11, 15) // 11:15
// t3 = timestamp(year, month, dayofmonth, 13, 15) // 1:15
// t4 = timestamp(year, month, dayofmonth, 15, 25) // 3:25
// // Check if the current bar is on the current day
// is_today = (year(time) == year(timenow)) and (month(time) == month(timenow)) and (dayofmonth(time) == dayofmonth(timenow))
// // Draw a vertical line at each time
// if is_today and (time == t1 or time == t2 or time == t3 or time == t4)
// line.new(x1 = bar_index, y1 = low, x2 = bar_index, y2 = high, extend = extend.both, color=color.red, width = 1)
strategy('Modified RSI')
col_grow_above = input(#02ac11, "Above Grow", group="Histogram", inline="Above")
col_fall_above = input(#6ee47d, "Fall", group="Histogram", inline="Above")
col_grow_below = input(#e5939b, "Below Grow", group="Histogram", inline="Below")
col_fall_below = input(#dd0000, "Fall", group="Histogram", inline="Below")
EMA_length = input.int(13, 'Price_EMA', minval=1)
RSI_length = input.int(14, 'RSI_Period', minval=1)
Avg_length = input.int(5, 'RSI_Avg_EMA', minval=1)
fastMA = ta.ema(close, EMA_length)
modrsi = ta.rsi(fastMA, RSI_length)
RSIAVG = ta.ema(modrsi, Avg_length)
plot(modrsi, color=color.rgb(38, 0, 255), linewidth=2)
plot(RSIAVG, color=color.rgb(247, 0, 0))
rsiUpperBand = hline(60, 'RSI Upper Band', color=#099b0e)
//hline(50, "RSI Middle Band", color=color.new(#787B86, 50))
rsiLowerBand = hline(40, 'RSI Lower Band', color=#e90101)
RSI_hist = modrsi - RSIAVG
//plot(RSI_hist,"RSI_Histogram", color = #c201e9, style = plot.style_columns,linewidth= 5)
plot(RSI_hist, title="RSI_Histogram", style=plot.style_columns, color=(RSI_hist>=0 ? (RSI_hist[1] < RSI_hist ? col_grow_above : col_fall_above) : (RSI_hist[1] < RSI_hist ? col_grow_below : col_fall_below)))
/////// Moving Averages 20 50 EMA
fast_ma = input.int(20, minval=2, title="Fast_EMA")
slow_ma = input.int(50, minval=2, title="Slow_EMA")
src = input.source(close, title="Source")
out = ta.ema(src, fast_ma)
out1 = ta.ema(src, slow_ma)
//plot(out, title="20 EMA", color=color.rgb(117, 71, 247), linewidth = 2)
//plot(out1, title="50 EMA", color=color.rgb(0, 0, 0), linewidth = 2)
longCondition = ((ta.crossover(modrsi, RSIAVG)) and (RSI_hist > 0))
if longCondition
strategy.entry('B', strategy.long)
shortCondition = ((ta.crossunder(modrsi, RSIAVG)) and (RSI_hist < 0))
if shortCondition
strategy.entry('S', strategy.short)