다중 지표 추세 추적 동적 위험 제어 양적 거래 전략

1
Follow
1782
Followers
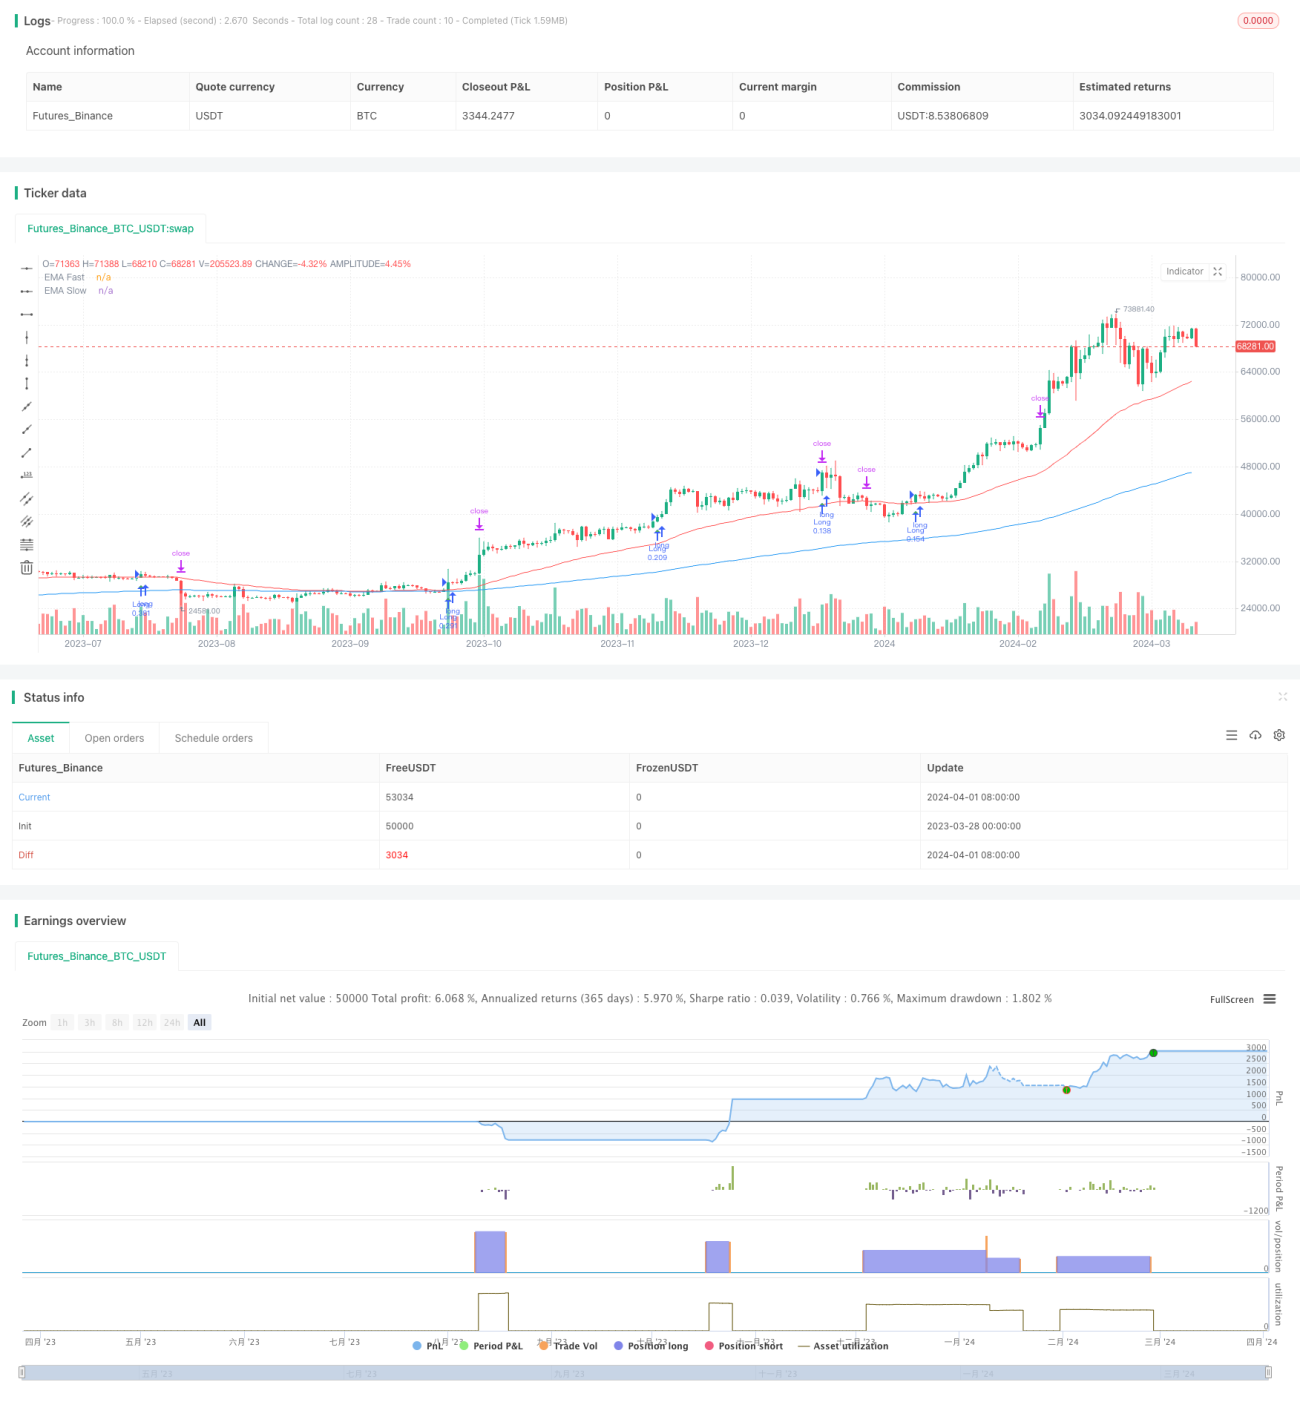
개요
이 전략은 상대적으로 약한 지수 ((RSI), 이동 평균 수렴 분산 지수 ((MACD), 지수 이동 평균 ((EMA) 및 평균 실제 파도 ((ATR) 와 같은 여러 기술 지표를 사용하여, 동적 포지션 관리 및 손실 중지 장치와 결합하여 포괄적인 추세를 추적하는 양적 거래 전략을 구현합니다. 이 전략은 가격의 속도, 방향, 강도 및 변동률을 분석하여 여러 시장 환경에서 적응하여 시장 추세를 포착하고 위험을 제어합니다.
전략 원칙
- RSI는 가격의 변화의 속도와 크기를 측정하고, 거래에 대한 신호를 제공하는 과매매 상태를 식별합니다.
- MACD는 빠른 이동 평균과 느린 이동 평균의 차이를 분석하여 가격의 운동량, 방향 및 강도의 변화를 판단하여 트렌드 전환점을 알려줍니다.
- 이중 EMA는 트렌드 방향을 확인합니다. 빠른 선은 느린 선을 돌파하는 것을 볼 수 있는 신호로 간주하고 빠른 선은 느린 선을 넘어가는 것을 볼 수 있는 신호로 간주합니다.
- ATR은 시장의 변동성을 측정하고, 시장의 다른 상태에 적응하기 위해 스톱 및 스톱 레벨을 동적으로 조정합니다.
- RSI, MACD, EMA의 여러 조건을 결합하여, 전략은 다목적 추세가 형성될 때 다목적 위치를 열고, 공허 추세가 형성될 때 공허 위치를 열는다.
- ATR을 스톱 로즈 기준으로 하고, 동적 수익 목표를 설정하고, 단일 거래의 리스크/이익 비율은 그대로 유지한다.
- 전략적 리스크 포지션과 지표의 자산 변동률을 기반으로, 거래 포지션을 동적으로 조정하여 리스크 포지션을 고정합니다.
전략적 이점
- 트렌드 추적: 여러 기술 지표에 기반한 전략으로 트렌드를 확인하고, 시장의 중·장기 트렌드 기회를 효과적으로 포착한다.
- 동적 위드 컨트롤: ATR의 동적 변화에 따라 중지 및 중지 레벨이 조정되며, 다양한 변동성 시장 상태에 적응하여 단일 거래 위험을 제어합니다.
- 포지션 관리: 계정 규모와 지표의 변동성을 고려하여 각 거래 포지션을 자동으로 최적화하여 전반적인 위험 <unk>을 안정적으로 유지한다.
- 유연성: 전략의 매개 변수는 다양한 시장, 종류 및 투자 스타일에 따라 유연하게 조정됩니다.
- 엄격한 규율: 수량적 규칙을 기반으로 거래를 수행하고, 주관적 감정의 영향을 제거하고, 전략의 객관성과 일관성을 보장한다.
전략적 위험
- 시장 위험: 금융 시장 자체의 불확실성, 경제, 정치, 갑작스러운 사건 등의 요인의 영향으로 전략 성과와 기대에서 벗어날 수 있습니다.
- 매개 변수 위험: 부적절한 매개 변수 설정으로 인해 전략이 역사 데이터에 과도하게 적합하여 실제 응용에서 좋지 않은 성능을 발휘할 수 있습니다.
- 슬라이드 포인트와 거래 비용: 실제 거래에서 발생하는 슬라이드 포인트와 수수료가 전략의 순 수익에 영향을 미칠 수 있다.
- 극단적 상황: 전략은 급격히 변화하는 변동률 환경, 유동성 고갈 등과 같은 극단적 상황에서는 큰 회수와 마주할 수 있다.
전략 최적화 방향
- 변수 최적화: 역대 데이터를 통해 최적의 변수 조합을 찾고, 전략의 안정성과 적응성을 향상시킵니다.
- 다수 공백 위치의 동적 구성: 시장 추세의 강도와 방향에 따라 다수 공백 위치 비율을 동적으로 조정하여 추세를 더 잘 파악한다.
- 시장 상태 판단: 변동률, 연관성 등의 지표와 결합하여 시장 상태를 판단하고, 다른 상태에서 그에 따른 전략 조정한다.
- 기본적 분석과 결합: 거시 경제, 산업 추세와 같은 기본 요소를 고려하여 기술 지표의 사용과 해석을 안내합니다.
- 위험 제어 최적화: 동적 중지 손해 차단에 기초하여, 포트폴리오 최적화, 헤지 도구 사용 등과 같은 고급 위험 관리 수단을 추가하십시오.
요약하다
이 전략은 RSI, MACD, EMA 등의 기술 지표의 유기적 결합을 통해 전체적인 트렌드 추적 거래 시스템을 구축한다. 전략은 동적인 포지션 및 위험 관리를 채택하여 트렌드 기회를 포착하면서 철회 위험을 제어한다. 전략은 광범위하게 적용되며 시장 특성과 투자 요구에 따라 최적화 조정할 수 있다. 그러나 실제 응용에서는 시장 위험, 매개 변수 설정, 거래 비용과 같은 요소에 주의를 기울이고 정기적으로 평가 및 최적화해야합니다. 신중한 위험 관리와 지속적인 최적화 개선으로 전략은 안정적이고 효율적인 수량 거래 도구가 될 수 있습니다.
Source
Pine
//@version=5
strategy("Enhanced Professional Strategy V6", shorttitle="EPS V6", overlay=true)

// Input parameters with tooltips for enhanced user understanding.
rsiPeriod = input.int(14, title="RSI Period", tooltip="Period length for the Relative Strength Index. Standard setting is 14. Adjust to increase or decrease sensitivity.")
macdFastLength = input.int(12, title="MACD Fast Length", tooltip="Length for the fast EMA in the MACD. Typical setting is 12. Adjust for faster signal response.")
macdSlowLength = input.int(26, title="MACD Slow Length", tooltip="Length for the slow EMA in the MACD. Standard setting is 26. Adjust for slower signal stabilization.")
macdSmoothing = input.int(9, title="MACD Smoothing", tooltip="Smoothing length for the MACD signal line. Commonly set to 9. Modifies signal line smoothness.")
atrLength = input.int(14, title="ATR Length", tooltip="Period length for the Average True Range. Used to measure market volatility.")
riskRewardRatio = input.float(2.0, title="Risk/Reward Ratio", tooltip="Your target risk vs. reward ratio. A setting of 2.0 aims for profits twice the size of the risk.")
emaFastLength = input.int(50, title="EMA Fast Length", tooltip="Period length for the fast Exponential Moving Average. Influences trend sensitivity.")
emaSlowLength = input.int(200, title="EMA Slow Length", tooltip="Period length for the slow Exponential Moving Average. Determines long-term trend direction.")Strategy parameters
Related strategies
Comment
All comments (0)
No data
- 1