RSI와 볼린저 밴드 듀얼 전략

1
Follow
1781
Followers
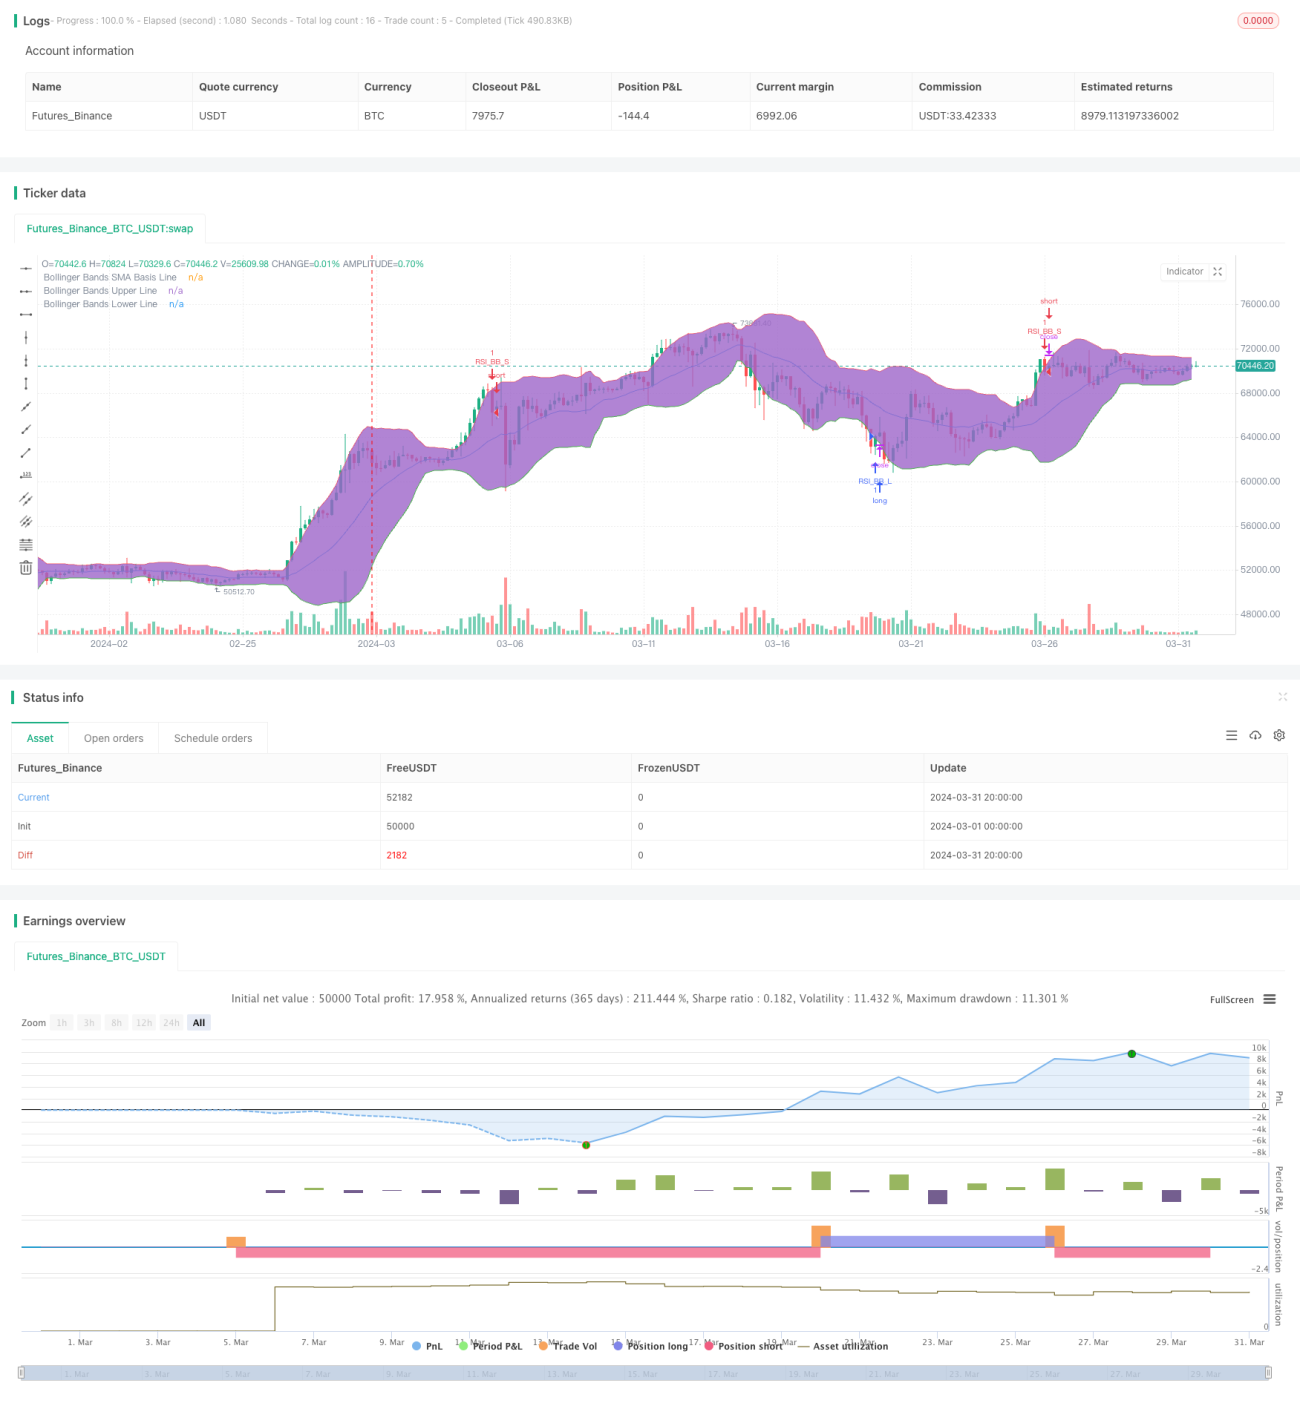
개요
이 전략은 상대적으로 강한 지수 ((RSI) 와 불린 밴드 ((Bollinger Bands) 의 두 가지 기술 지표를 결합하여, 가격이 불린 밴드 아래로 내려갈 때 구매 신호를 발생시키고, 가격이 불린 밴드 위로 올라갈 때 판매 신호를 발생시킨다. 이 전략은 RSI 지표와 불린 밴드 지표가 동시에 과매 또는 과매 상태에 있을 때만 거래 신호를 유발한다.
전략 원칙
- 설정된 RSI 변수에 따라 RSI 값을 계산한다.
- 부린띠 공식을 사용하여 부린띠 중간, 상단, 하단 철도를 계산한다.
- 현재 종전 가격이 부린을 뚫고 올라갔는지 내려갔는지 판단한다.
- 현재 RSI 값이 오버 바이 시점보다 높고 오버 시점보다 낮다는 것을 판단한다.
- 부린 띠와 RSI 지표가 동시에 구매 또는 판매 조건을 충족하면, 해당 거래 신호가 생성됩니다.
전략적 이점
- 트렌드와 동력이라는 두 가지 기술 지표가 결합되어 시장 상태를 더 포괄적으로 판단할 수 있습니다.
- 동시에 두 개의 지표를 필터링 조건으로 사용하면 가짜 신호의 발생 가능성을 효과적으로 감소시킵니다.
- 코드 논리는 명확하고, 변수 설정은 다양한 시장 환경과 거래 스타일에 적합하다.
전략적 위험
- 이 전략은 불안정한 시장에서 더 많은 손실 거래가 발생할 수 있습니다.
- 잘못된 매개 변수 설정으로 인해 전략이 제대로 작동하지 않을 수 있으며 실제 상황에 따라 최적화가 필요합니다.
- 이 전략은 스톱로스를 설정하지 않았기 때문에 더 큰 철회 위험에 직면할 수 있습니다.
전략 최적화 방향
- 시장 특성과 개인 선호에 따라 RSI와 브린 밴드의 파라미터를 최적화 할 수 있습니다.
- 다른 기술 지표들 (MACD, 평균선 등) 을 도입하여 신호의 신뢰성을 높였다.
- 합리적인 스톱 로즈와 스톱 스<unk>을 설정하고, 단일 거래의 위험을 제어한다.
- 불안정한 시장의 경우, 판단 조건을 높이는 것을 고려할 수 있으며, 거래의 빈도와 관련된 비용을 줄일 수 있습니다.
요약하다
RSI와 부린 벨트 이중 전략은 추세와 동력 지표를 결합하여 시장 상태를 비교적으로 종합적으로 판단하고 그에 따른 거래 신호를 줄 수 있습니다. 그러나 이 전략은 불안한 시장에서 좋지 않은 성능을 발휘할 수 있으며 위험 제어 조치를 설정하지 않은 상태에서 신중하게 실행해야합니다. 매개 변수를 최적화하고 다른 지표를 도입하고 합리적인 스톱 스<unk>을 설정하는 등의 방법으로 이 전략의 안정성과 수익성을 더욱 향상시킬 수 있습니다.
Source
Pine
/*backtest
start: 2024-03-01 00:00:00
end: 2024-03-31 23:59:59
period: 4h
basePeriod: 15m
exchanges: [{"eid":"Futures_Binance","currency":"BTC_USDT"}]
*/

//@version=4
strategy("Bollinger + RSI, Double Strategy (by ChartArt) v1.1", shorttitle="CA_-_RSI_Bol_Strat_1.1", overlay=true)

// ChartArt's RSI + Bollinger Bands, Double Strategy - UpdateStrategy parameters
Related strategies
Comment
All comments (0)
No data
- 1