듀얼 타임 스케일 모멘텀 전략

1
Follow
1786
Followers
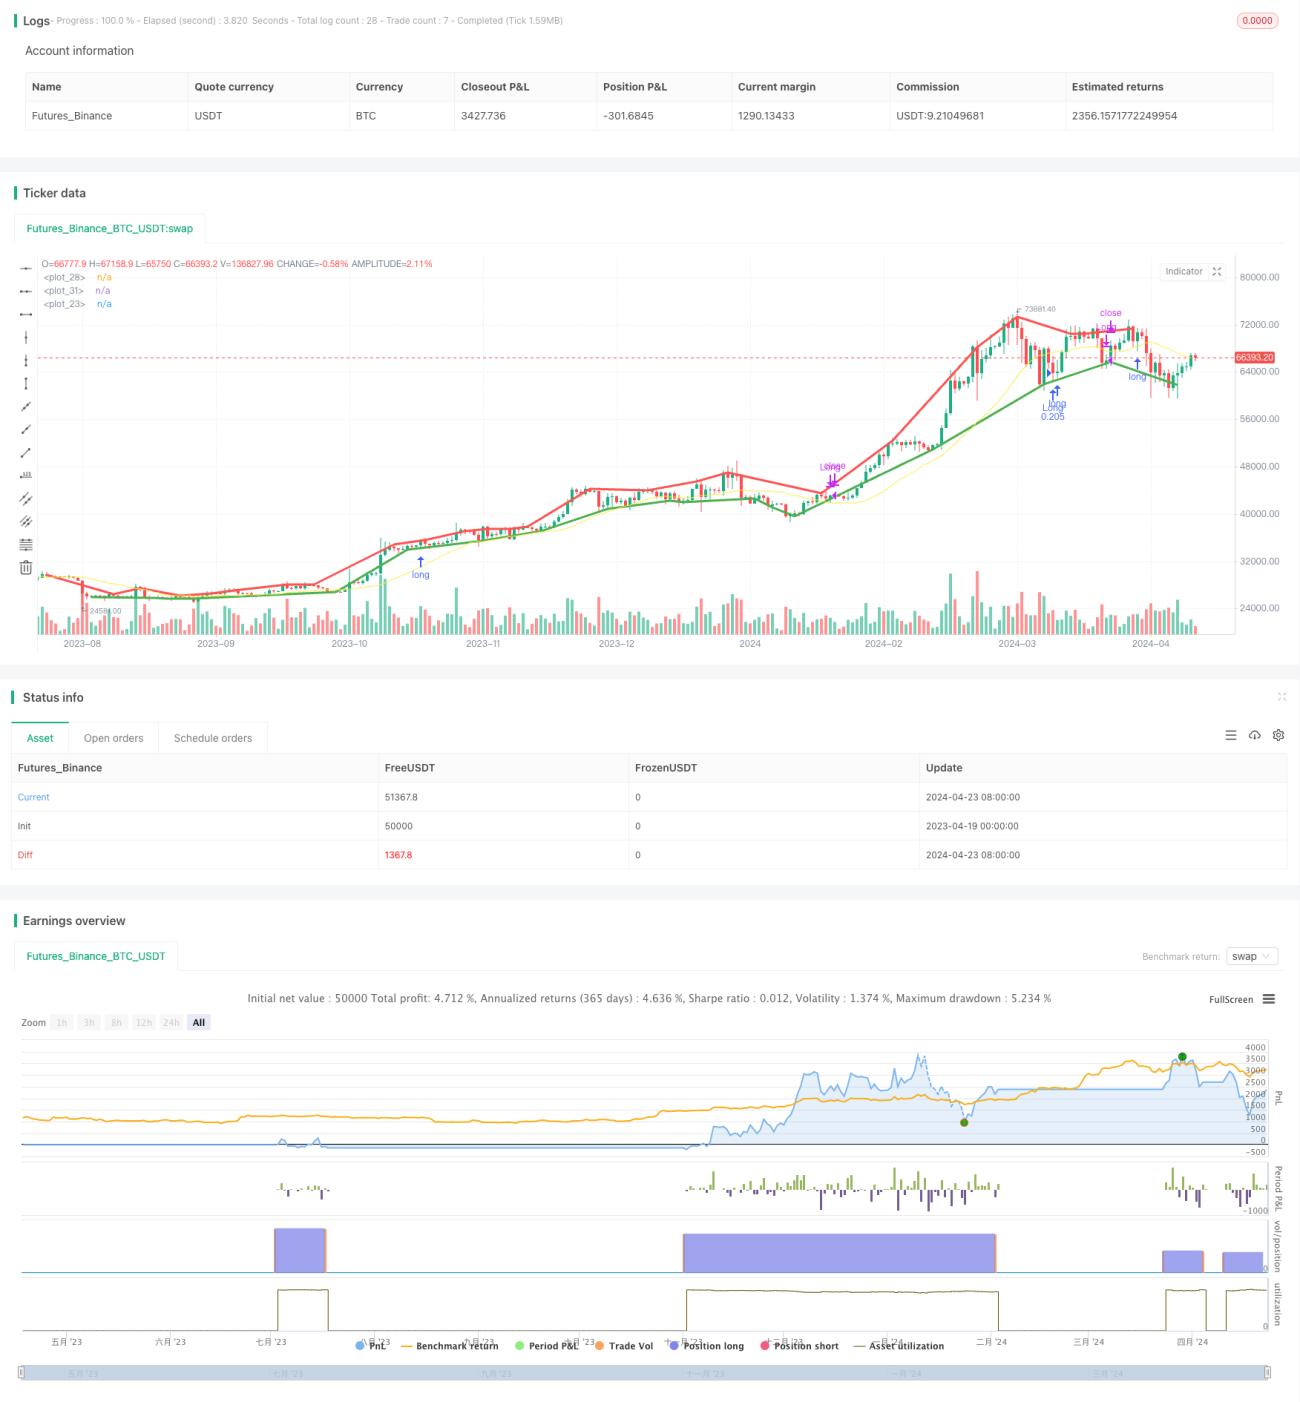
개요
이 전략은 이중 시간 스케일 동전 전략이다. 그것은 상위 시간 주기에서 간단한 이동 평균을 사용하여 트렌드 방향을 판단하고, 하위 시간 주기에서 축점 (PivotLow와 PivotHigh) 을 사용하여 역점을 식별한다. 상위 시간 주기에서 상승 추세와 하위 시간 주기에서 수평 축점이 있을 때 더 많이 열리고, 상위 시간 주기에서 하향 추세와 하위 시간 주기에서 수평 축점이 있을 때 빈 공간이다.
전략 원칙
이 전략의 주요 원칙은 상위 레벨 시간 주기의 트렌드 방향이 하위 레벨 시간 주기의 움직임을 영향을 미친다는 것입니다. 상위 레벨 시간 주기에서 상승 추세가 나타났을 때, 하위 레벨 시간 주기의 회전이 구매 기회일 가능성이 더 높습니다. 상위 레벨 시간 주기에서 하향 추세가 나타났을 때, 하위 레벨 시간 주기의 반동은 빈 기회일 가능성이 더 높습니다. 이 전략은 간단한 이동 평균 (SMA) 을 사용하여 상위 레벨 시간 주기의 트렌드 방향을 판단하고, 축점 (PivotLow 및 PivotHigh) 을 사용하여 하위 레벨 시간 주기의 전환점을 식별합니다.
전략적 이점
- 이중 시간 스케일 분석은 상위 수준의 시간 주기에서 낮은 수준의 시간 주기에 대한 영향을 활용하여 거래의 성공 확률을 증가시킵니다.
- SMA를 사용하여 트렌드 방향을 판단하는 것이 더 신뢰할 수 있으며, 축축점을 사용하여 역전점을 포착하는 것이 더 정확하다.
- 매개 변수는 조정할 수 있고, 적응력이 강하다. 사용자는 자신의 요구에 따라 높고 낮은 시간 척도, SMA의 주기, 중심점의 매개 변수 등을 조정할 수 있다.
- 논리적으로 명확하고, 이해하기 쉽고, 실행하기 쉽다.
전략적 위험
- 트렌드 변동 위험. 높은 수준의 시간 주기에서 트렌드가 갑자기 변하면, 낮은 수준의 시간 주기에는 반응이 없을 수 있으며, 전략이 실패하게됩니다.
- 매개 변수 설정 위험. 부적절한 매개 변수 설정은 전략의 부적절한 성과를 초래할 수 있다. 예를 들어, SMA 주기를 너무 짧게 선택하면 거래 빈도가 높아질 수 있고, 너무 길게 선택하면 추세 판단이 늦어질 수 있다.
- 극단적인 상황 위험. 극단적인 상황 (폭풍이 폭락하는 것과 같은) 에서 이 전략은 실패할 수 있다. 왜냐하면 이런 상황에서는 낮은 레벨의 시간 주기들이 높은 레벨의 시간 주기들의 경향을 따르지 않을 수 있기 때문이다.
전략 최적화 방향
- 트렌드 변화의 판단을 추가한다. 상위 계층의 시간 주기 트렌드가 변했는지 판단하는 논리를 추가하여 하위 계층의 시간 주기 트레이드를 더 빠르게 조정할 수 있다.
- 최적화 변수 선택 <unk> 어떤 변수 최적화 방법을 사용하여 (유전적 알고리즘, 그리드 검색 등) 최적의 변수 조합을 찾을 수 있다.
- 위험 통제를 늘리십시오. 극단적인 상황에서의 손실을 줄이기 위해 위험 통제의 몇 가지 조치를 추가 할 수 있습니다.
- 다인자 융합. 전략의 안정성을 높이기 위해 전략에 다른 지표 또는 요소 (유동률, 거래량 등) 를 통합하는 것을 고려할 수 있습니다.
요약하다
이 쌍 시간 스케일 동력 전략은 높은 낮은 수준의 시간 주기 사이의 연결을 활용하여 높은 수준의 시간 주기에서 트렌드 방향을 판단하여 낮은 수준의 시간 주기에서 반전점을 포착하여 트렌드 따라와 반전 거래를 실현한다. 이 전략의 논리는 명확하고 장점은 분명하지만 동시에 위험도 있습니다.
Source
Pine
Strategy parameters
Related strategies
Comment
All comments (0)
No data
- 1