
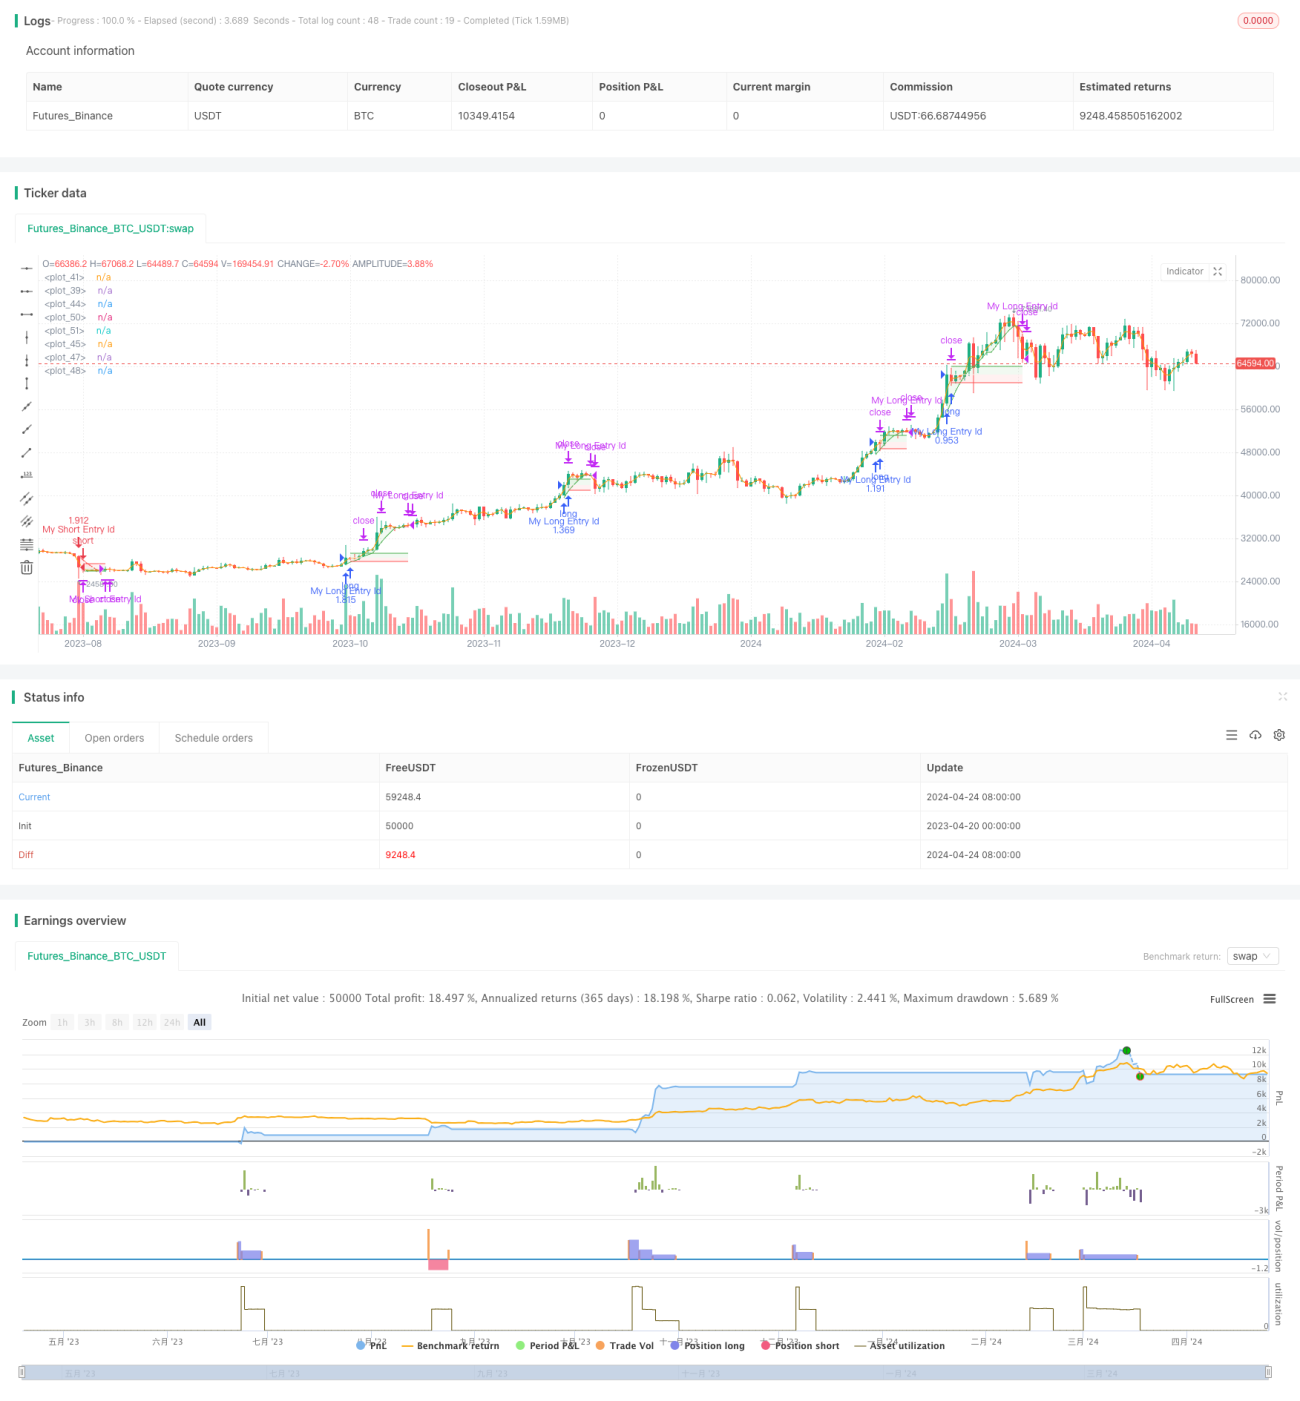
트렌드 캡처 전략은 트렌드 형성을 감지하는 독특한 방법을 사용하여 트렌드 방향에 입장을 개설하는 전략이다. 그것은 특정 범위의 최고 가격과 최저 가격의 차이를 그 범위의 모든 K 라인 길이의 합과 비교하여 “한계”라고 불리는 비율 값을 얻는다. 그 값이 100에 가까울수록 트렌드가 강하다는 것을 의미합니다.
트렌드 캡처 전략은 트렌드 형성을 탐지하고 트렌드 방향에 대해 포지션을 개시하는 독특한 방법을 사용합니다. 제한값을 계산하여 트렌드 강도를 판단하고 이동 평균을 통과하여 트렌드를 종료합니다. 전략은 포지션을 개시한 후 일부 포지션을 평면화하고 이동 스톱포드를 사용하여 위험을 제어합니다. 그러나, 전략은 트렌드 초기에 포지션을 개시하는 것은 위험이있을 수 있습니다. 고정된 스톱포드를 사용하는 것은 충분히 유연하지 않을 수 있으며 이동 평균을 사용하여 트렌드를 판단하는 것은 약간의 기회를 놓칠 수 있습니다.
/*backtest
start: 2023-04-20 00:00:00
end: 2024-04-25 00:00:00
period: 1d
basePeriod: 1h
exchanges: [{"eid":"Futures_Binance","currency":"BTC_USDT"}]
*/
// This source code is subject to the terms of the Mozilla Public License 2.0 at https://mozilla.org/MPL/2.0/
// © faytterro
//@version=5
strategy("Trend Catcher Strategy", overlay=true, default_qty_type = strategy.percent_of_equity, default_qty_value = 100)
len = input.int(10)
tp = input.float(2.5, step = 0.1)
sl = input.float(2.5, step = 0.1)
malen = input.int(5)
limit = input.int(50)
ma = ta.sma(close,malen)
sum = 0.0
for i = 0 to len-1
sum := sum + high[i]-low[i]
frs = 100*(ta.highest(high,len)-ta.lowest(low,len))/sum
//hline(50)
//plot(frs, color = color.white)
l = ta.crossover(frs,limit) and ma>ma[1]
s = ta.crossover(frs,limit) and ma<ma[1]
cl = ma<ma[1]
cs = ma>ma[1]
qty_balance=input.int(50, maxval = 100)
if (l)
strategy.entry("My Long Entry Id", strategy.long)
strategy.exit("exit long", "My Long Entry Id", qty_percent = qty_balance, limit = close*(100+tp)/100, stop = close*(100-sl)/100)
if (s)
strategy.entry("My Short Entry Id", strategy.short)
strategy.exit("exit short", "My Short Entry Id", qty_percent = qty_balance, limit = close*(100-tp)/100, stop = close*(100+sl)/100)
if (cl)
strategy.close("My Long Entry Id")
if (cs)
strategy.close("My Short Entry Id")
l:= l and strategy.opentrades<1
s:= s and strategy.opentrades<1
transp = strategy.opentrades>0? 0 : 100
pma=plot(ma, color = ma<ma[1]? color.rgb(255, 82, 82, transp) : color.rgb(76, 175, 79, transp))
price = open/2+close/2
pprice = plot(price, display = display.none)
fill(pma,pprice, color = ma<ma[1]? color.rgb(255, 82, 82, transp+90) : color.rgb(76, 175, 79, transp+90))
spm=plot(ta.valuewhen(s,close,0), color = (strategy.opentrades>0 and ma<ma[1] and ma[1]<ma[2])? color.white : color.rgb(1,1,1,100), offset=1)
lpm=plot(ta.valuewhen(l,close,0), color = (strategy.opentrades>0 and ma>ma[1] and ma[1]>ma[2])? color.white : color.rgb(1,1,1,100), offset=1)
ltp=plot(ta.valuewhen(l,close,0)*(100+ta.valuewhen(l,tp,0))/100, color = (strategy.opentrades>0 and ma>ma[1] and ma[1]>ma[2])? color.green : color.rgb(1,1,1,100), offset=1)
lsl=plot(ta.valuewhen(l,close,0)*(100-ta.valuewhen(l,sl,0))/100, color = (strategy.opentrades>0 and ma>ma[1] and ma[1]>ma[2])? color.red : color.rgb(1,1,1,100), offset=1)
stp=plot(ta.valuewhen(s,close,0)*(100-ta.valuewhen(s,tp,0))/100, color = (strategy.opentrades>0 and ma<ma[1] and ma[1]<ma[2])? color.green : color.rgb(1,1,1,100), offset=1)
ssl=plot(ta.valuewhen(s,close,0)*(100+ta.valuewhen(s,sl,0))/100, color = (strategy.opentrades>0 and ma<ma[1] and ma[1]<ma[2])? color.red : color.rgb(1,1,1,100), offset=1)
fill(stp,spm, color = (strategy.opentrades>0 and ma<ma[1] and ma[1]<ma[2])? color.rgb(76, 175, 79, 90) : color.rgb(1,1,1,100))
fill(ssl,spm, color = (strategy.opentrades>0 and ma<ma[1] and ma[1]<ma[2])? color.rgb(255, 82, 82, 90) : color.rgb(1,1,1,100))
fill(ltp,lpm, color = (strategy.opentrades>0 and ma>ma[1] and ma[1]>ma[2])? color.rgb(76, 175, 79, 90) : color.rgb(1,1,1,100))
fill(lsl,lpm, color = (strategy.opentrades>0 and ma>ma[1] and ma[1]>ma[2])? color.rgb(255, 82, 82, 90) : color.rgb(1,1,1,100))