베가스 슈퍼 트렌드 강화 전략

개요
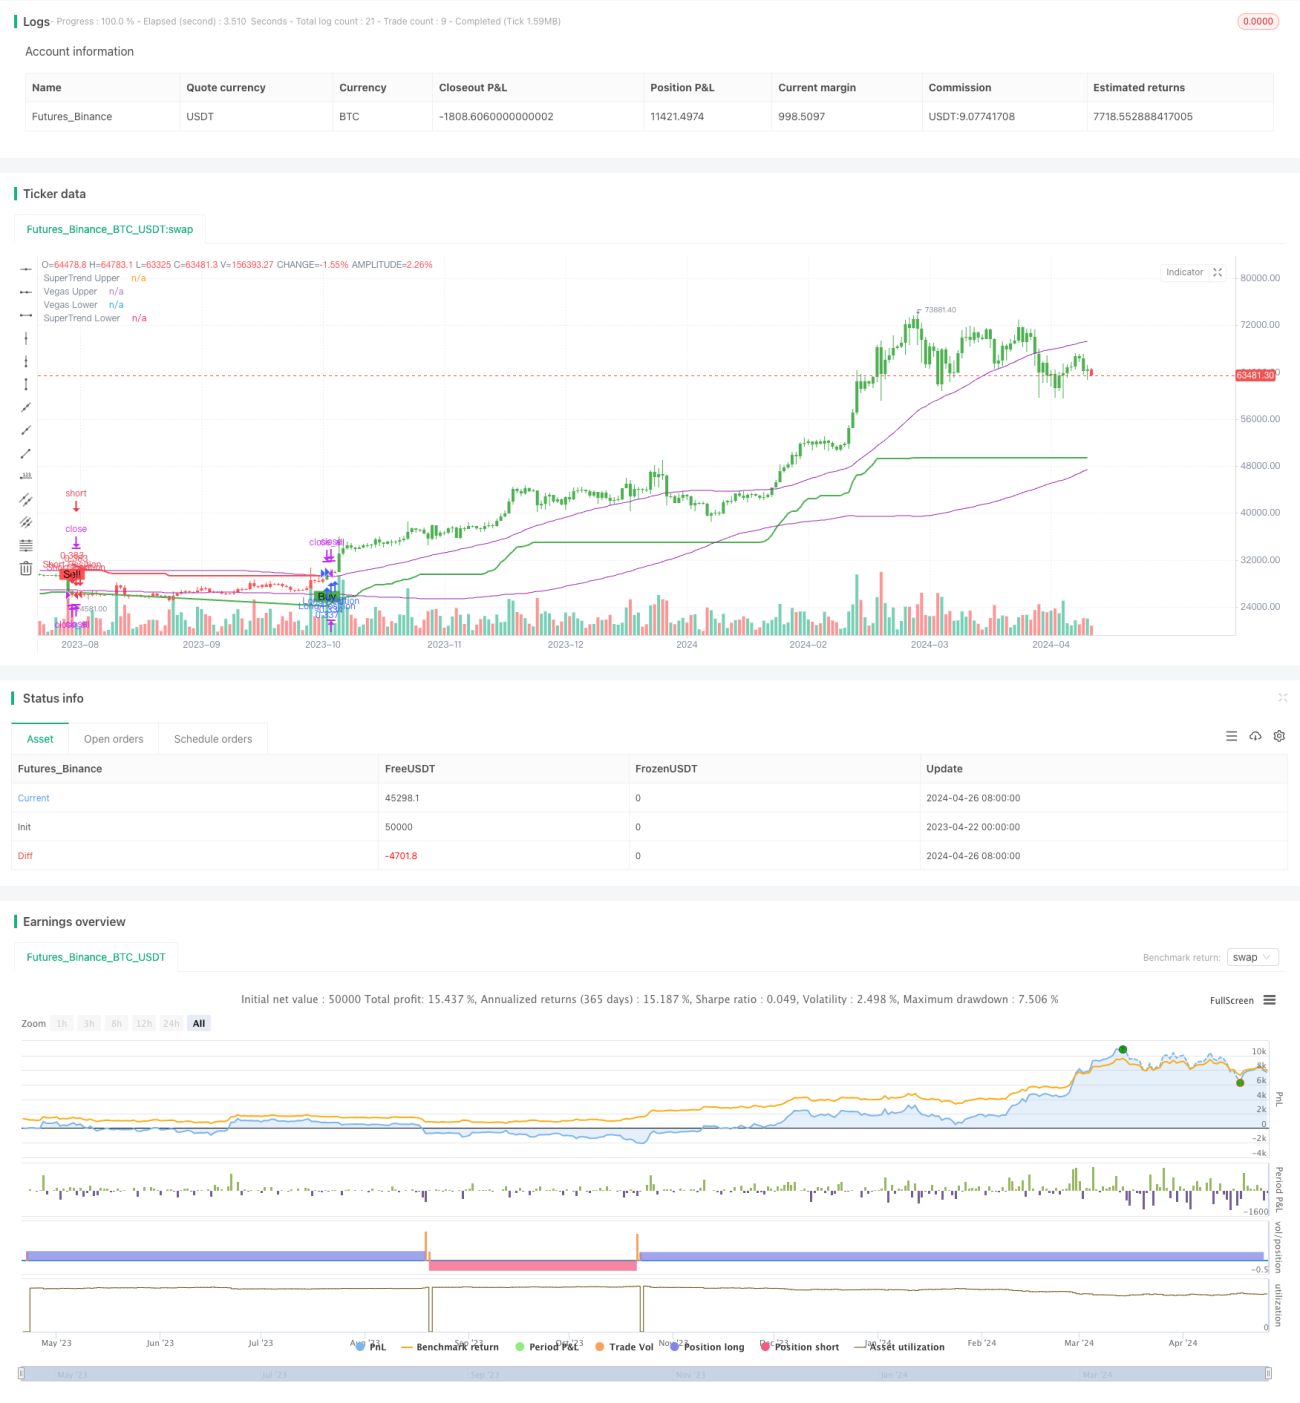
"베가스 슈퍼 트렌드 강화 전략"은 베가스 채널과 슈퍼 트렌드 지표의 민감성을 동적으로 조정하여 다양한 시장 변동 상황에 적응하는 혁신적인 거래 전략입니다. 이 전략은 베가스 채널을 사용하여 시장의 변동성을 측정하고 이를 기반으로 슈퍼 트렌드 지표의 매개 변수를 조정하여 트렌드를 추적하면서 시장의 변화에 더 잘 적응합니다. 이 전략은 가격과 슈퍼 트렌드 지표의 상대적 위치에 따라 구매 및 판매 신호를 생성하며, 다중, 공백 또는 양방향 거래를 할 수있는 유연한 거래 방향을 제공합니다. 이 전략은 시각적으로 매우 효과적이며, 초록색과 빨간색의 간결한 표시를 사용하여 다중 및 공백의 추세를 식별하여 트레이더가 시장의 추세를 빠르게 파악할 수 있습니다.
전략 원칙
이 전략의 핵심은 베가스 채널과 슈퍼트렌드 지표의 결합이다. 베가스 채널은 간단한 이동 평균 ((SMA) 와 표준 차기 ((STDEV) 를 사용하여 가격의 상하 변동 범위를 결정한다. 채널의 폭은 시장의 변동 정도를 반영한다. 슈퍼트렌드 지표는 트렌드 추적 지표로, 현재 가격과 지표 값의 상대적 위치를 비교하여 트렌드 방향을 판단한다.
전략은 SuperTrend 지표의 배수를 동적으로 조정하여 베가스 채널의 폭 변화에 적응합니다. 베가스 채널이 넓을 때 (즉, 시장의 변동성이 높을 때) SuperTrend 지표의 배수는 그에 따라 증가하여 추세 변화에 더 민감하게 반응합니다. 반대로, 베가스 채널이 좁을 때 (즉, 시장의 변동성이 낮을 때) 배수는 감소하여 지표가 더 안정적이고 건전합니다.
거래 신호의 생성은 현재의 종결 가격과 슈퍼트렌드 지표값의 비교를 기반으로 한다. 가격이 아래에서 위쪽으로 슈퍼트렌드 지표선을 통과할 때, 다중 신호가 생기고, 반대로 가격이 위에서 아래로 지표선을 통과할 때, 공백 신호가 생기는 것이다. 이러한 단순하고 직관적인 신호 판단 방식은 이 전략을 이해하기 쉽고 적용하기 쉽다.
전략적 이점
-
동적으로 시장의 변동에 적응: Vegas 채널을 통해 SuperTrend 지표의 매개 변수를 동적으로 조정하여 다른 시장의 변동 상황에 적응할 수 있도록하고, 트렌딩 시장에서 트렌드를 적시에 포착하고, 흔들리는 시장에서 안정성을 유지할 수 있습니다.
-
간결하고 직관적인 거래 신호: 전략은 가격과 슈퍼트렌드 지표의 상대적 위치에 따라 명확한 매매 신호를 생성하여 거래자가 신속하게 결정을 내릴 수 있도록 간단하고 이해하기 쉽습니다.
-
유연한 거래 방향 선택: 전략은 다단, 공단 및 양방향 거래의 세 가지 옵션을 제공하여 다양한 거래자의 요구와 시장 관점을 충족시킵니다.
-
뛰어난 시각적 도움말: 전략은 초록색과 빨간색으로 상표에 다중 및 공백 트렌드를 표시하고, 화살표로 구매 및 판매 지점을 표시하여 시장의 맥박을 파악하는 데 도움이됩니다.
전략적 위험
-
트렌드 인식 지연: 모든 트렌드 추적 전략과 마찬가지로, 이 전략은 트렌드 회전 초기에 신호 지연이 발생할 수 있으며, 이로 인해 최적의 출입 시기를 놓치거나 추가 위험을 감수할 수 있습니다.
-
매개 변수 설정 민감성: 전략의 성능은 ATR 주기, 베가스 채널 길이 등과 같은 매개 변수의 선택에 어느 정도 의존하며, 다른 매개 변수는 다른 결과를 가져올 수 있다.
-
자주 거래: 전략은 추세 변화에 민감하며, 불안정한 시장에서 자주 거래 신호를 생성하여 거래 비용과 철회 위험을 증가시킬 수 있습니다.
전략 최적화 방향
-
더 많은 지표를 도입: RSI, MACD 등과 같은 다른 기술 지표를 도입하는 것을 고려하여 트렌드 신호를 다차원으로 검증하여 신호의 신뢰성을 향상하십시오.
-
입력 및 출력 규칙을 최적화: 현재 입력 신호를 기반으로 더 많은 필터링 조건을 도입 할 수 있습니다. 예를 들어, 연속적인 K 라인 종료 가격이 트렌드 방향에 유지되도록 요구합니다. 가짜 신호를 줄이기 위해; 또한 이동 스톱 또는 변동율 스톱을 설정하여 출전을 최적화 할 수 있습니다.
-
동적 조정 포지션: 시장 추세의 강도, 변동성 등의 지표에 따라 각 거래의 포지션을 동적으로 조정하고, 추세가 강할 때 포지션을 높이고, 추세가 약할 때 포지션을 줄여서 위험을 더 잘 제어하고 수익을 최적화한다.
요약하다
"Vegas SuperTrend Enhanced 전략"은 혁신적인 트렌드 추적 거래 전략으로, 트렌드 식별과 시장 적응의 유기적 결합을 실현합니다. 전략 거래 신호는 명확하고 적응력이 강하며, 시각적 보조 효과가 뛰어나지만, 트렌드 식별 지연, 변수 민감 등과 같은 고유한 위험에 직면합니다.
/*backtest
start: 2023-04-22 00:00:00
end: 2024-04-27 00:00:00
period: 1d
basePeriod: 1h
exchanges: [{"eid":"Futures_Binance","currency":"BTC_USDT"}]
*/

// This Pine Script™ code is subject to the terms of the Mozilla Public License 2.0 at https://mozilla.org/MPL/2.0/
// © PresentTrading

// The "Vegas SuperTrend Strategy" uses Vegas Channel and SuperTrend indicators on trading charts, allowing for adjustable settings like ATR length and channel size. - 1