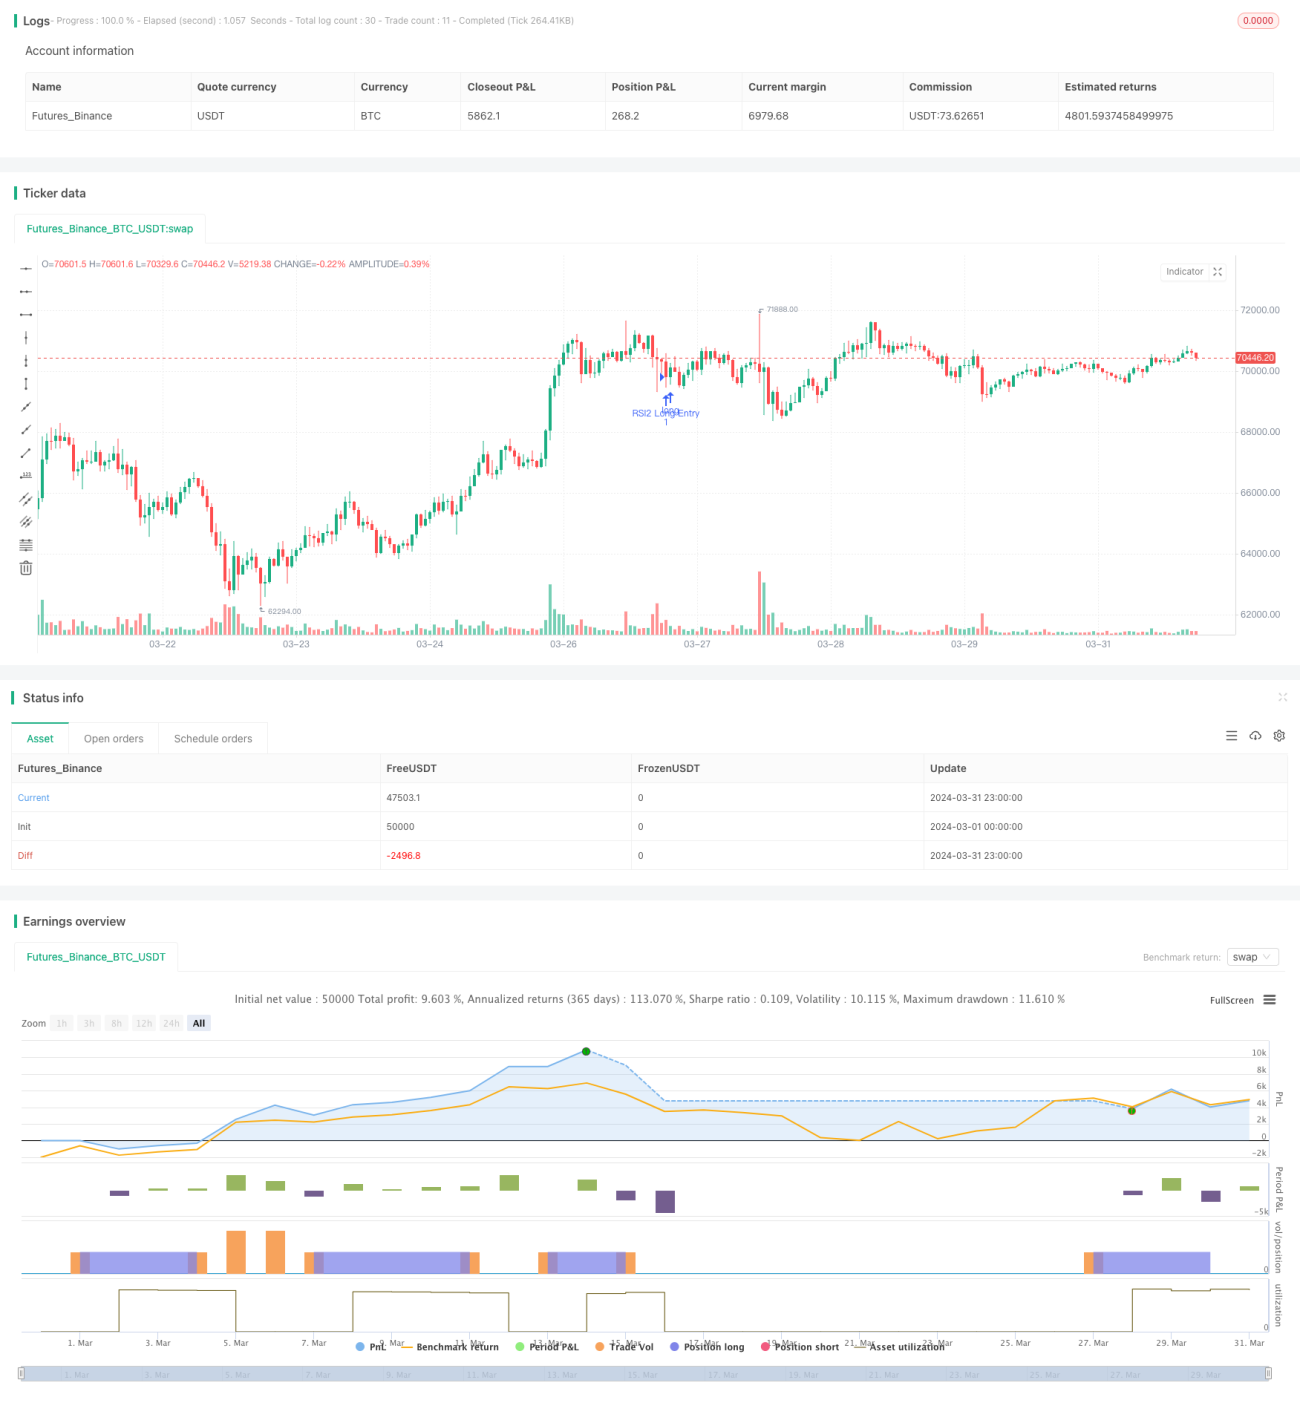
RSI2 전략 일중 반전 승률 백테스트

1
Follow
1780
Followers
개요
이 전략은 상대적으로 약한 지수 ((RSI) 지표의 과매매 신호를 기반으로, 하루의 낮은 시점에 구매하고, 그 다음 고정된 비율의 정지 및 상실을 설정하여, 전략이 정지 및 상실을 접촉했을 때 재검토한다. 주요 아이디어는 RSI 지표의 과매매 시점에 반전 기회를 이용하고, 하루의 낮은 시점에 개입하여 반전으로 인한 단기 수익을 취하는 것이다. 동시에, 이동 평균선을 사용하여 필터링 트렌드를 사용하여, 평균선보다 가격이 높을 때만 시장을 더 많이 한다.
전략 원칙
- 2주기 RSI와 200주기 간단한 이동 평균을 계산합니다.
- 매매가 평균보다 높고 RSI가 초상가치보다 작을 때 (기본 10) 다음 거래일 개시 시점에 매입
- 입시 가격으로 하루 최저 구매 가격을 기록합니다.
- 6%의 정지 가격과 3%의 정지 가격으로 입시 가격으로 계산됩니다.
- 다음 거래일에는, 스톱<unk>을 만지면 매매가 종료되고, 스톱 손실을 만지면 매매가 종료됩니다.
- 정지 및 손실의 수를 계산하고, 설정된 주기의 승리율을 계산하는 전략
우위 분석
- 하루의 하위점을 매입하여 당일 RSI 오버소드를 통해 반전 수익을 얻습니다.
- 단편 거래 위험을 제어하기 위한 고정 비율의 스톱<unk>과 스톱 손실
- 장기 주기 평균선 필터를 사용하여 역동 거래 상황을 줄이십시오.
- 간단하고 사용하기 쉽고, 변수 설정이 유연하며, 단선 거래자에게 적합합니다.
위험 분석
- RSI 과매매는 변하는 것을 보장하지 않으며, 극단적 인 경우 시장이 계속 하락 할 수 있습니다.
- 고정 비율의 스톱 스톱 손실은 거래 비용을 커버하지 않을 수 있습니다.
- 진입점은 하루 최저 가격을 기준으로 하고, 실제적으로 가장 낮은 가격에서 구매하는 것은 매우 어렵습니다.
- 트렌드 판단이 부족하여 오버 바이 오버 셀 신호에 의존하면 수익률이 높지 않을 수 있습니다.
최적화 방향
- 적응 스톱 스톱 손실을 사용하여 가격 변동률과 같은 지표에 따라 동적으로 조정
- MACD, DMI 등과 같은 트렌드 확인 지표에 가입하여 역전 거래를 피하십시오.
- 입시점을 최적화하여, 예를 들어, 변수 거리 해수욕장 거래법을 사용함
- 포지션 관리를 강화하고 투자 활용도와 수익률을 높여라
- 다른 단기 주기 지표와 결합하여, 부린 밴드, KDJ 등과 같은 신호 확인도를 높인다.
요약하다
RSI2 전략은 RSI 지표가 초과된 후 일간 반전 기회를 포착하여 고정 비율의 중지 손실을 설정하여 위험을 제어하고, 장기 주기평균선을 사용하여 역동 신호를 필터링합니다. 이 전략의 아이디어는 간단하며, 짧은 라인 투기 거래자에게 적합합니다. 그러나 트렌드 판단이 부족하여 가장 낮은 시점에 정확하게 구매하는 것이 어렵고 고정된 중지 손실은 전략의 수익 공간을 제한합니다.
Source
Pine
Strategy parameters
Related strategies
Comment
All comments (0)
No data
- 1