Z-점수 기반 추세 추종 전략

1
Follow
1782
Followers
개요
"Z값 기반의 트렌드 추적 전략"은 Z값이라는 통계적 지표를 사용하여 가격의 이동 평균에서 벗어난 정도를 측정하고 표준 차이를 표준화 척도로 사용하여 트렌딩 기회를 포착합니다. 이 전략은 간결함과 효과로 유명하며 특히 가격 움직임이 평준으로 돌아가는 시장에 적합합니다. 여러 지표에 의존하는 복잡한 시스템과 달리 "Z값 트렌드 전략"은 명확하고 통계적으로 눈에 띄는 가격 변화에 초점을 맞추고 있으며, 정밀 데이터 중심의 방법을 선호하는 거래자에게 적합합니다.
전략 원칙
이 전략의 핵심은 Z값을 계산하는 데 있습니다. Z값은 현재 가격과 사용자 정의 길이의 가격 지수 이동 평균 (EMA) 의 차이를 계산하여 동일한 길이의 가격 기준으로 나누어집니다.
z = (x - μ) / σ
그 중, x는 현재 가격,μ는 EMA 평균,σ는 표준차이다.
트레이딩 신호는 Z값이 미리 정해진 지점을 넘어서서 생성된다:
- 다중 입구: Z값이 상향으로 정지점을 통과할 때
- 다중 출전: Z값이 마이너스 임계값을 아래로 통과할 때
- 허공 입구: Z값이 마이너스 임계값을 아래로 통과할 때
- 공중으로 출전: Z값이 상향으로 양극을 통과할 때
전략적 이점
- 간결하고 효과적입니다. 이 전략은 몇 가지 변수에만 의존하며, 이해하기 쉽고 실행할 수 있으며, 유행 기회를 잡는 데 탁월합니다.
- 통계학적 기초: Z값은 전략에 대한 견고한 이론적 기초를 제공하는 정교한 통계학적 도구이다.
- 유연성: 마이너스, EMA, 표준 격차 계산 주기 등의 변수를 조정하여 전략은 다양한 거래 스타일과 시장 환경에 유연하게 적응할 수 있습니다.
- 명확한 신호: Z값을 기준으로 한 거래 신호는 간단하고 명확하여 신속한 의사결정과 실행에 도움이 됩니다.
전략적 위험
- 변수 민감: 부적절한 변수 설정 (<unk>값이 너무 높거나 너무 낮다) 는 거래 신호를 부정확하게 만들거나 기회를 놓치고 손실을 초래할 수 있습니다.
- 트렌드 인식: 이 전략은 종종 잘못된 신호를 받으며, 흔들림이나 재조정 시에는 좋지 않은 성능을 나타낼 수 있습니다.
- 지연 효과: 트렌드 추적 전략으로, 입구 및 출구 신호 모두 지연되어 최적의 시점을 놓칠 수 있습니다.
이 위험은 지속적인 시장 분석, 변수 최적화 및 재검토에 기초하여 신중하게 실행하여 제어 및 완화 할 수 있습니다.
전략 최적화 방향
- 동적 <unk>값: 변동률과 관련된 동적 <unk>값을 도입하여 다양한 시장 상태에 효과적으로 적응하여 신호 품질을 향상시킵니다.
- 조합 지표: RSI, MACD 등과 같은 다른 기술 지표를 통합하여 거래 신호를 2차 확인하여 신뢰성을 높인다.
- 포지션 관리: ATR 등의 포지션 제어 장치를 포함하여, 흔들리는 시장에서 적시에 포지션을 줄이고, 트렌드 시장에서 적시에 포지션을 올리고, 수익 위험 비율을 최적화한다.
- 다중 시차: 여러 시차에 걸쳐 Z값을 계산하여 다양한 수준의 트렌드를 포착하고, 전략 차원을 풍부하게 합니다.
요약하다
"Z-값 기반의 트렌드 추적 전략"은 간단하고 안정적이며 유연한 특성으로 트렌드 기회를 잡기 위해 독특한 관점을 제공합니다. 합리적인 파라미터 설정, 신중한 위험 관리 및 지속적인 최적화를 통해 이 전략은 양자 거래자가 변화하는 시장에서 안정적으로 나아갈 수 있도록 도와줄 것입니다.
Source
Pine
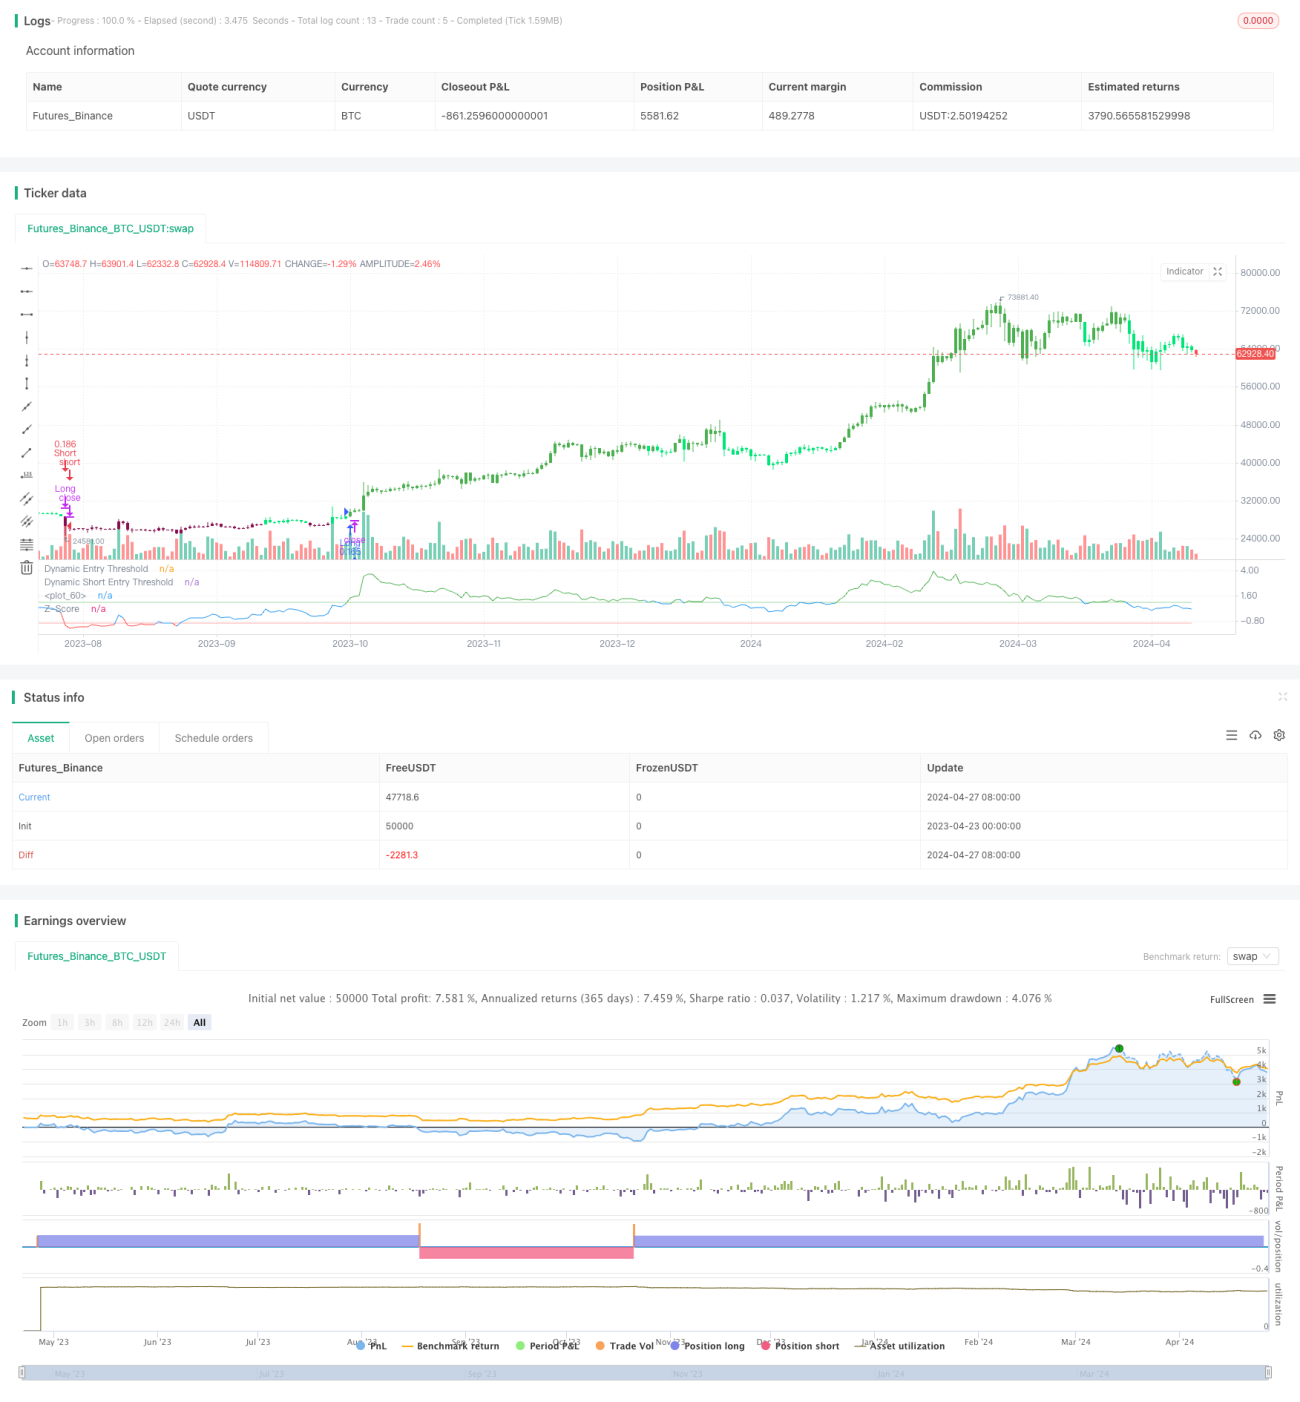
/*backtest
start: 2023-04-23 00:00:00
end: 2024-04-28 00:00:00
period: 1d
basePeriod: 1h
exchanges: [{"eid":"Futures_Binance","currency":"BTC_USDT"}]
*/

// This Pine Script™ code is subject to the terms of the Mozilla Public License 2.0 at https://mozilla.org/MPL/2.0/
// © PresentTrading

// This strategy employs a statistical approach by using a Z-score, which measures the deviation of the price from its moving average normalized by the standard deviation.Strategy parameters
Related strategies
Comment
All comments (0)
No data
- 1