개요
이 전략은 20일과 55일 두 지수 이동 평균 ((EMA) 의 교차를 사용하여 거래 신호를 판단한다. 단기 EMA에서 장기 EMA를 통과할 때 구매 신호를 발송하고, 반대로 판매 신호를 발송한다. 전략은 또한 레버리지 거래를 도입하여 레버리지로 수익을 확대하고 동시에 위험을 확대한다. 또한, 전략은 조건 제한을 추가하고, 두 개의 평행선이 교차한 후에만 가격이 단기 라인 평행선을 만질 때만 포지션을 열고, 가짜 신호의 위험을 줄인다. 마지막으로, 사용자는 간단한 이동 평균 ((MA) 을 EMA 대신 사용 할 수도 있습니다.
전략 원칙
- 20일과 55일 EMA (또는 MA) 를 계산한다.
- 단기 EMA가 장기 EMA를 입는지 여부를 판단하기 위해, 만약 그렇다면, readyToEnter 변수를 true로 설정하여, 출입을 준비할 수 있음을 나타냅니다.
- 만약 readyToEnter가 true이고 가격이 단기 EMA를 만지면, 구매를 실행하고, readyToEnter를 false로 다시 설정한다.
- 만약 단기 EMA 아래에서 장기 EMA를 다면, 평점이다.
- 레버리지를 기준으로 포지션 크기를 설정한다.
- 사용자 설정된 피드백 범위 내에서만 정책을 실행한다.
전략적 이점
- 평균선 교차는 대부분의 시장에 적합한 간단한 트렌드 판단 방법이다.
- 리베이트 거래를 도입하여 수익을 증대시킬 수 있습니다.
- 위기 신호의 위험을 줄이기 위해 조건 제한을 추가하십시오.
- EMA와 MA 두 가지 평선 옵션을 제공하여 사용자들의 선호도에 맞게 조정할 수 있다.
- 코드 구조는 명확하고 이해하기 쉽고 수정하기 쉽습니다.
전략적 위험
- 리버리지 거래는 위험을 증가시키고, 잘못된 판단으로 인해 큰 손실이 발생할 수 있습니다.
- 평균자책점 크로스에는 지연성이 존재하며, 최고의 출전 시기를 놓칠 수 있다.
- 유행이 뚜렷한 시장에서만 적용되며, 시장의 흔들림이 발생하면 거래가 빈번하게 이루어져 높은 수수료가 발생할 수 있습니다.
전략 최적화 방향
- 현재 시장에 가장 적합한 매개 변수를 찾기 위해 평균 주기를 최적화 할 수 있습니다.
- RSI, MACD 등과 같은 다른 지표들을 도입하여 종합적인 추세를 판단하여 승률을 높일 수 있다.
- 단편 거래의 위험을 제어하기 위해 스톱로스 및 스톱 스을 설정할 수 있습니다.
- 시장의 변동율에 따라 레버리 크기를 조정할 수 있으며, 변동시간에 레버리 크기를 늘리고, 변동시간에 레버리 크기를 줄일 수 있다.
- 기계 학습 알고리즘을 도입할 수 있으며, 최적화 매개 변수를 스스로 적응할 수 있다.
요약하다
이 전략은 평평선 교차와 레버리지 거래를 결합하여 시장 추세를 파악하면서 수익을 증대시킵니다. 그러나 레버리지 또한 높은 위험을 가져오고 신중하게 사용해야합니다. 또한, 이 전략에는 더 많은 지표, 동적 조정 매개 변수 등을 도입하여 전략의 성능을 향상시킬 수있는 최적화 공간이 있습니다.
전략 소스 코드
/*backtest
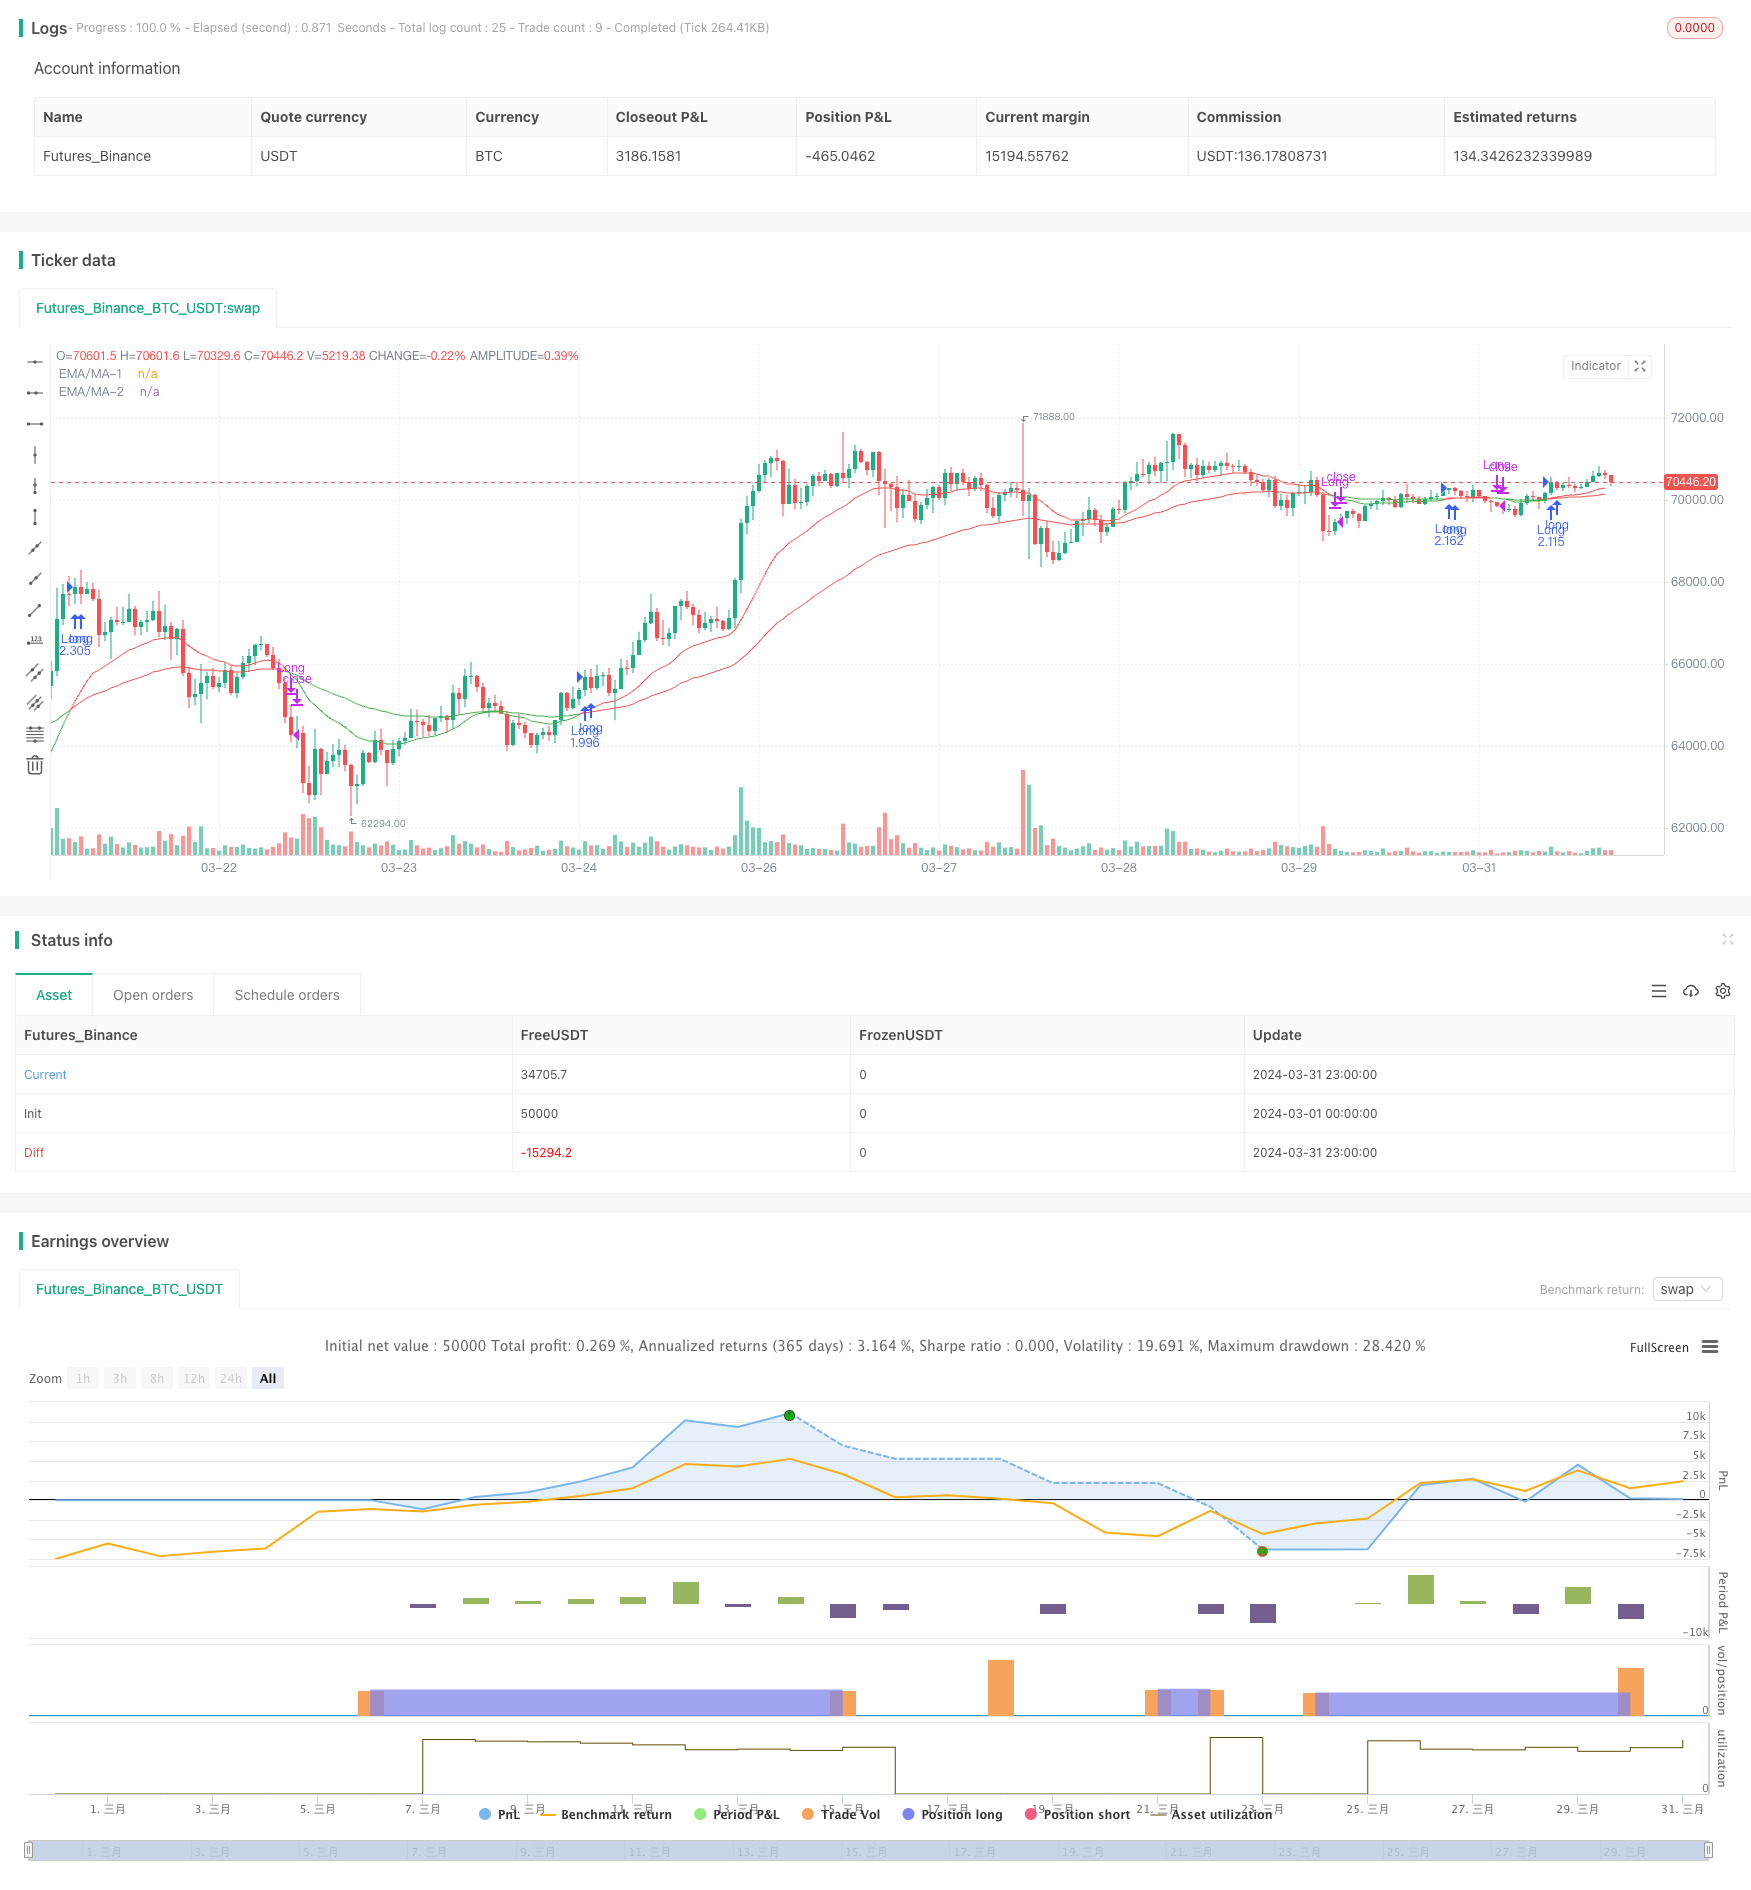
start: 2024-03-01 00:00:00
end: 2024-03-31 23:59:59
period: 1h
basePeriod: 15m
exchanges: [{"eid":"Futures_Binance","currency":"BTC_USDT"}]
*/
//@version=5
strategy("EMA Crossover Strategy with Leverage, Conditional Entry, and MA Option", overlay=true, default_qty_type=strategy.percent_of_equity, default_qty_value=100)
// Inputs for backtesting period
startDate = input(defval=timestamp("2023-01-01"), title="Start Date")
endDate = input(defval=timestamp("2024-04-028"), title="End Date")
// Input for leverage multiplier
leverage = input.float(3.0, title="Leverage Multiplier", minval=1.0, maxval=10.0, step=0.1)
// Input for choosing between EMA and MA
useEMA = input.bool(true, title="Use EMA (true) or MA (false)?")
// Input source and lengths for MAs
src = close
ema1_length = input.int(20, title='EMA/MA-1 Length')
ema2_length = input.int(55, title='EMA/MA-2 Length')
// Calculate the MAs based on user selection
pema1 = useEMA ? ta.ema(src, ema1_length) : ta.sma(src, ema1_length)
pema2 = useEMA ? ta.ema(src, ema2_length) : ta.sma(src, ema2_length)
// Tracking the crossover condition for strategy entry
crossedAbove = ta.crossover(pema1, pema2)
// Define a variable to track if a valid entry condition has been met
var bool readyToEnter = false
// Check for MA crossover and update readyToEnter
if (crossedAbove)
readyToEnter := true
// Entry condition: Enter when price touches MA-1 after the crossover // and (low <= pema1 and high >= pema1)
entryCondition = readyToEnter
// Reset readyToEnter after entry
if (entryCondition)
readyToEnter := false
// Exit condition: Price crosses under MA-1
exitCondition = ta.crossunder(pema1, pema2)
// Check if the current bar's time is within the specified period
inBacktestPeriod = true
// Execute trade logic only within the specified date range and apply leverage to position sizing
if (inBacktestPeriod)
if (entryCondition)
strategy.entry("Long", strategy.long, qty=strategy.equity * leverage / close)
if (exitCondition)
strategy.close("Long")
// Plotting the MAs for visual reference
ema1_color = pema1 > pema2 ? color.red : color.green
ema2_color = pema1 > pema2 ? color.red : color.green
plot(pema1, color=ema1_color, style=plot.style_line, linewidth=1, title='EMA/MA-1')
plot(pema2, color=ema2_color, style=plot.style_line, linewidth=1, title='EMA/MA-2')