RSI50_EMA 롱 포지션 전략

1
Follow
1780
Followers
개요
이 전략은 "RSI50_EMA 장점 전략"이라고 불리며, 주요 아이디어는 상대적으로 강한 지수 ((RSI) 와 지수 이동 평균 ((EMA) 의 두 가지 기술 지표의 교차 신호를 사용하여 거래 결정을 내리는 것입니다. 가격이 아래에서 위로 EMA 상도를 돌파하고 RSI가 50 이상일 때 장점을 열고, 가격이 위에서 아래로 EMA 하도를 돌파하거나 RSI가 50 평점을 넘어설 때 장점을 열습니다. 이 전략은 더 많이하고, 공백하지 않고, 추적 전략입니다.
전략 원칙
- EMA와 ATR을 계산하면 EMA가 궤도에 오르거나 떨어지는 것을 알 수 있다.
- RSI를 계산하기
- 마감 가격에 EMA가 궤도에 오르면 RSI가 50보다 크면 더 많은 지분을 <unk>니다.
- 종결시 EMA를 넘어오거나 RSI가 50을 넘어오면 모든 상자를 매각한다.
- 더 많은 것을 하고, 더 적은 것을 하지 말라.
전략적 이점
- 강세 시장에서 사용하기에 적합하며, 강세 주식의 상승세를 효과적으로 포착할 수 있다.
- 동시 EMA와 RSI 두 지표를 사용하여 트렌드 신호를 더 잘 확인하고 신호의 신뢰성을 향상시킬 수 있습니다.
- 포지션 관리는 손실의 비율을 적용하고, 위험을 통제할 수 있다.
- 코드 논리는 명확하고 간단하며, 이해하기 쉽고 구현하기 쉽습니다.
전략적 위험
- 이 시장은 종종 거래와 큰 인출이 발생하기 쉽다.
- 매개 변수 선택이 잘못되면 신호가 실패한다. 예를 들어, EMA 길이가 잘못 선택되면 추세 판단이 지연된다. RSI 상하계가 잘못 선택되면 평준화 지점이 바람직하지 않다.
- 전략은 한방의 상승세를 잡을 수 있을 뿐이고, 하락과 흔들림은 파악할 수 없고, 무작위로 넘어갈 수 있다.
전략 최적화 방향
- 트렌드 확인 지표 (MACD 등) 를 도입하여 트렌드 판단의 정확도를 높여줍니다.
- RSI에 대한 변수 최적화, 또는 RSI 이탈과 같은 개선 신호를 도입한다.
- 이동 상쇄 또는 변동률 상쇄를 추가하고, 바람 조절을 개선하는 것을 고려하십시오.
- 위기시장과 하향 추세에서 역전개 포지션 논리를 고려할 수 있다.
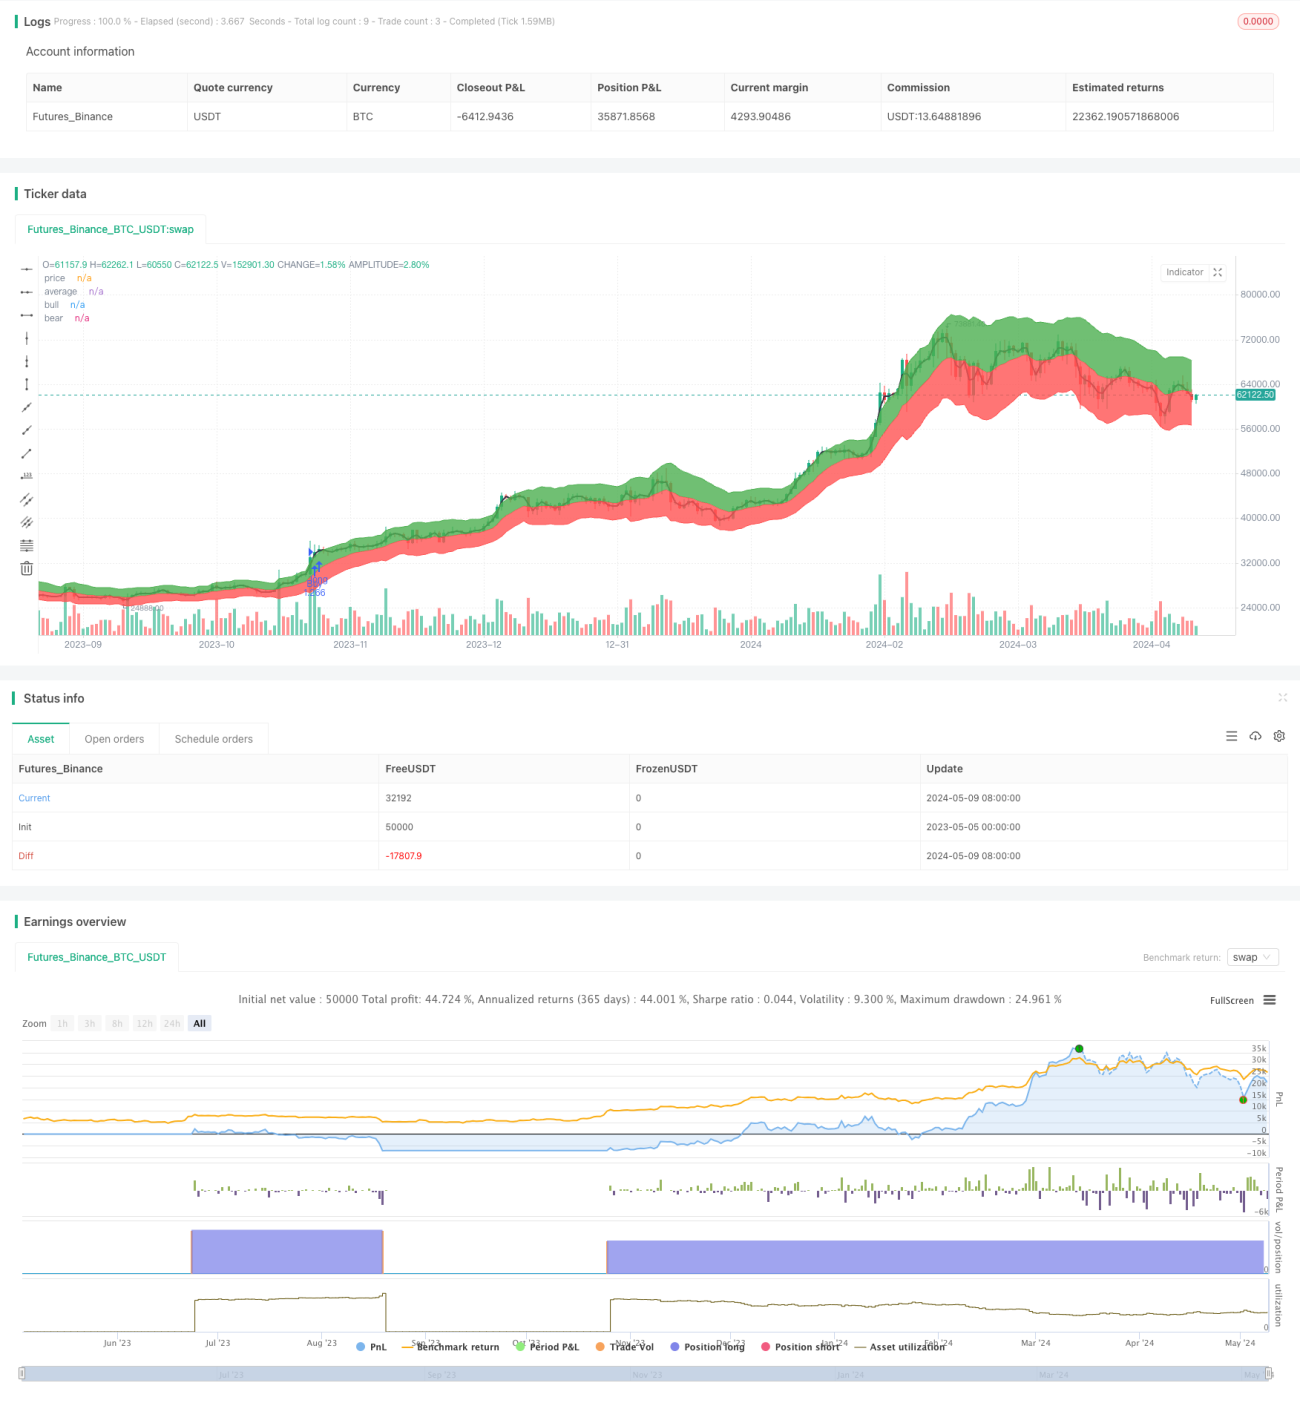
요약하다
RSI50_EMA 장거리 전략은 RSI와 EMA를 기반으로 한 간단하고 사용하기 쉬운 트렌드 추적 전략으로, 단방향 상승 상황에서 사용하기에 적합하다. 이 전략의 논리는 명확하고 장점은 분명하지만, 일부 결점과 위험도 존재한다. 더 많은 보조 지표, 최적화 매개 변수, 위험 제어 개선 등의 조치를 도입함으로써 이 전략의 안정성과 수익성을 더욱 향상시킬 수 있다. 그러나 실제 적용에서는 시장 특성, 개인 위험 선호 등의 요인에 따라 유연하게 조정 및 개선해야 한다.
Source
Pine
/*backtest
start: 2023-05-05 00:00:00
end: 2024-05-10 00:00:00
period: 1d
basePeriod: 1h
exchanges: [{"eid":"Futures_Binance","currency":"BTC_USDT"}]
*/

//@version=4
strategy("RSI50_EMA Long Only Strategy", overlay=true, default_qty_type=strategy.percent_of_equity, default_qty_value=100)

len = input(11, type=input.integer, minval=1, title="Length")Strategy parameters
Related strategies
Comment
All comments (0)
No data
- 1