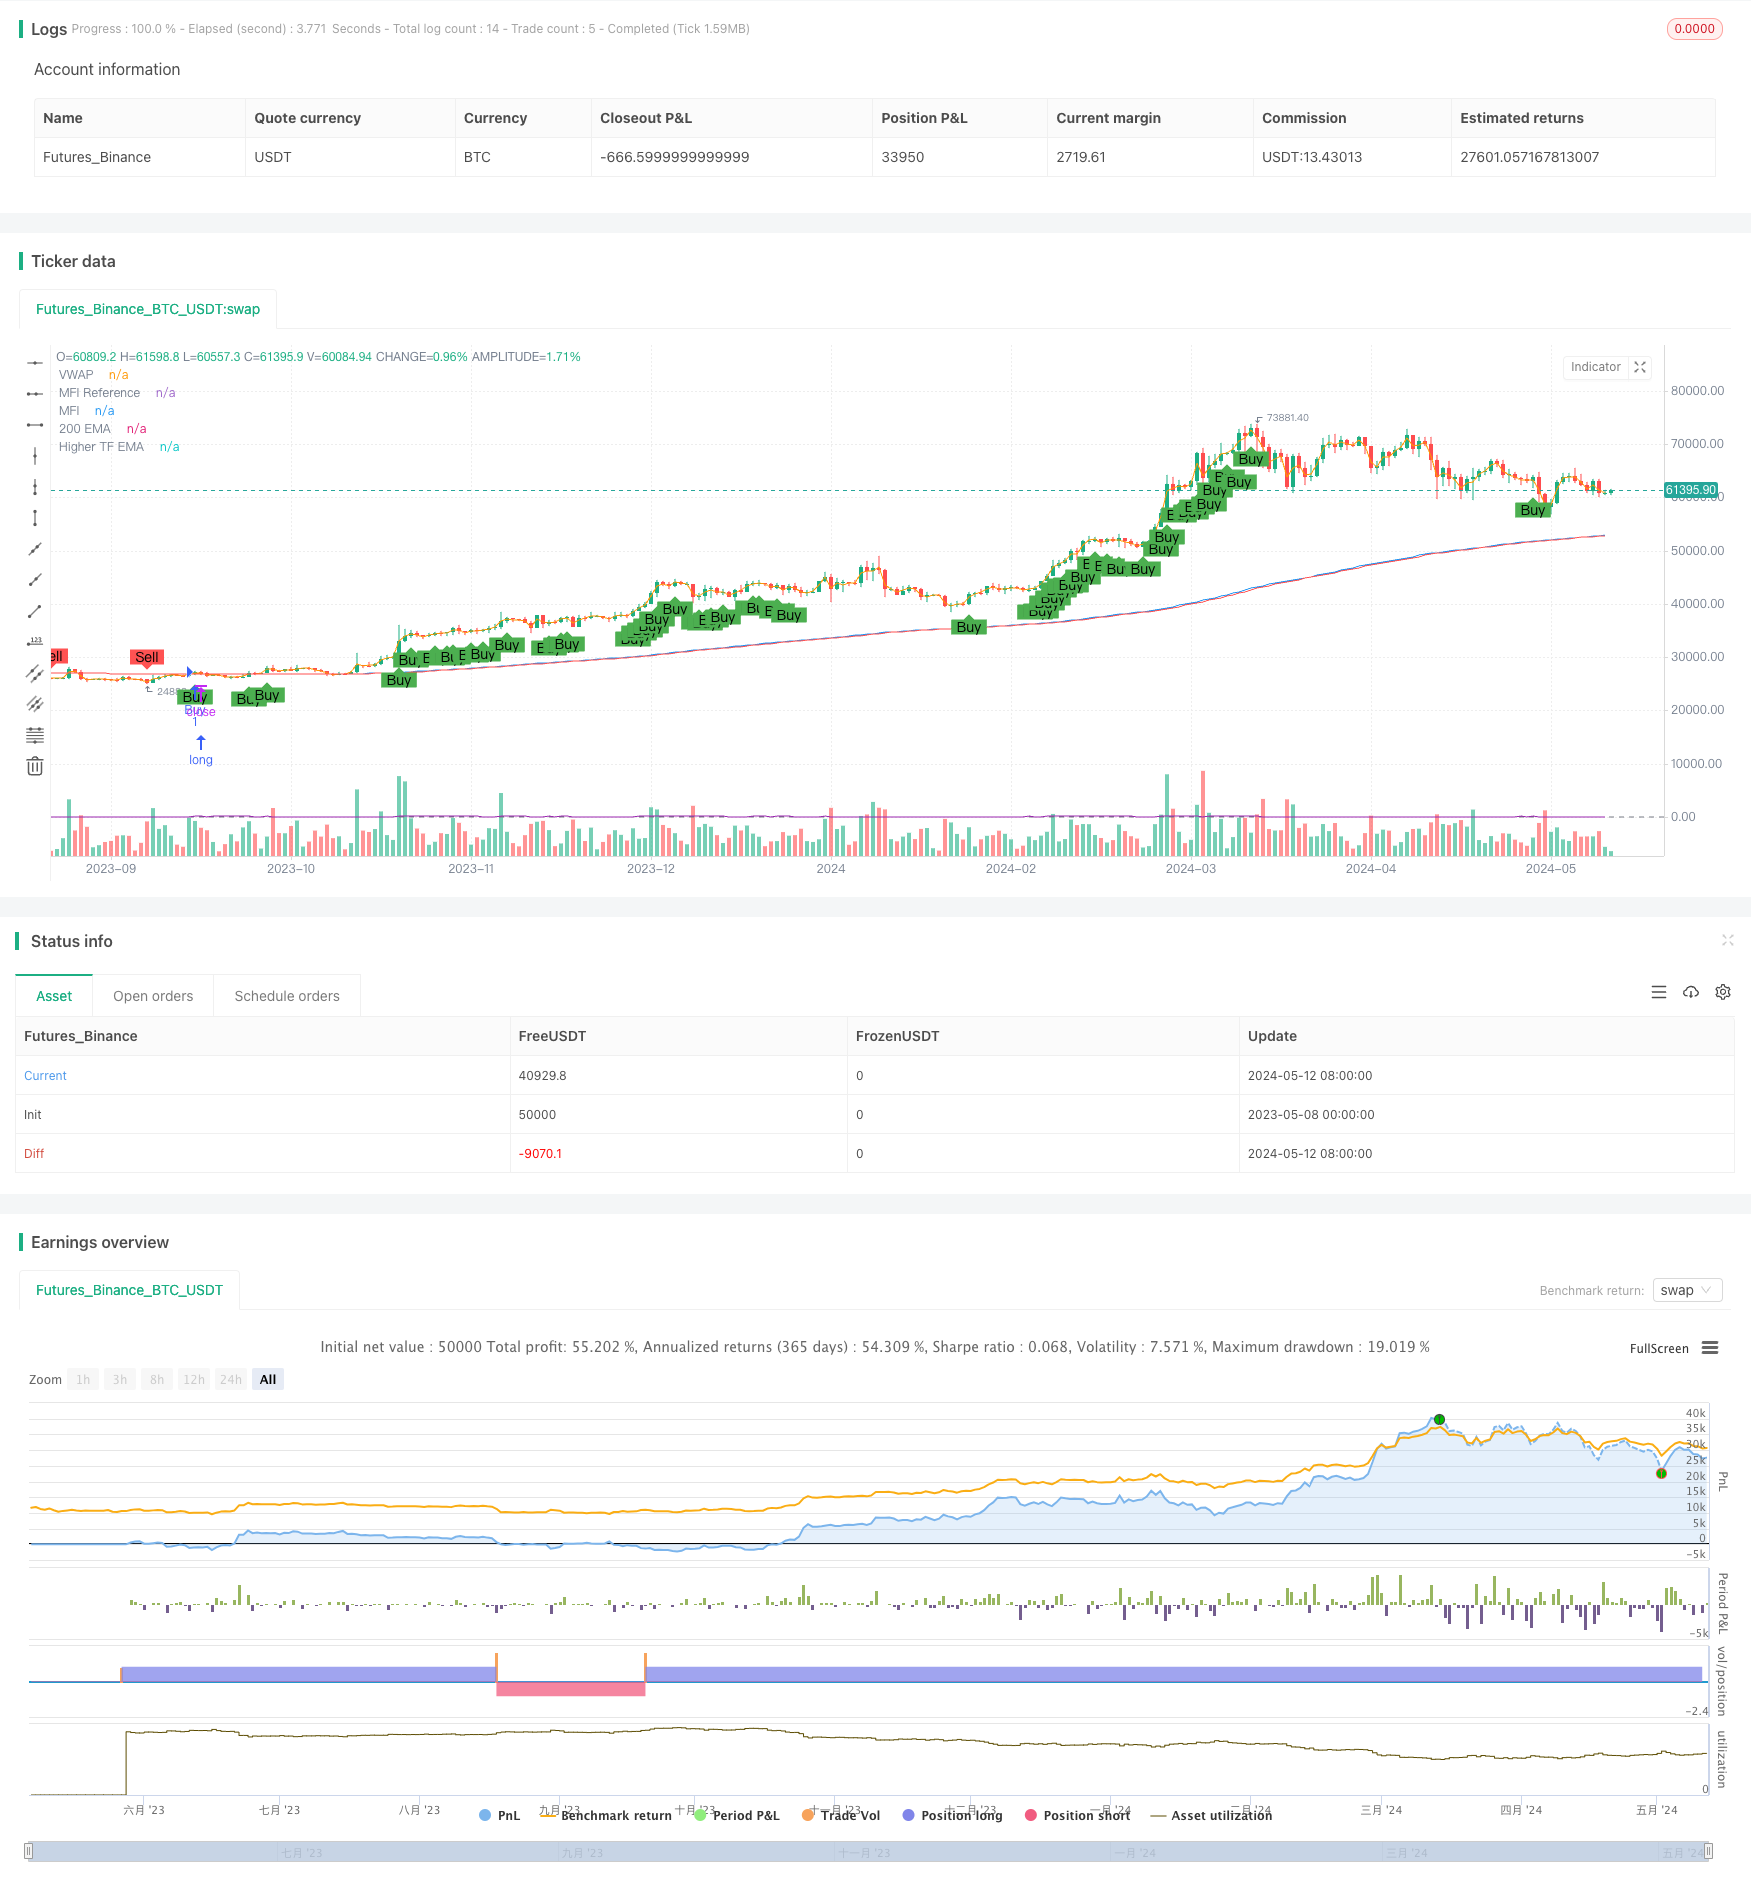
개요
이 전략은 200일 지수 이동 평균 ((200 EMA), 거래량 가중 평균 가격 ((VWAP), 그리고 자금 흐름 지표 ((MFI) 를 결합하여 매매 신호를 생성한다. 주요 아이디어는 이 세 가지 지표의 조합을 사용하여 트렌드 방향과 강도를 판단하고, 가격이 200 EMA를 돌파하고 VWAP 및 MFI 지표가 확인되면 거래 신호를 생성하는 것이다. 동시에, 상위 시간 주기의 200 EMA를 트렌드 필터로 도입하고, 현재 시간 주기와 상위 시간 주기의 트렌드가 일치하는 경우에만 거래한다. 또한, 가격 움직임의 연속성을 판단하여 신호의 신뢰성을 높인다.
전략 원칙
- 200일 EMA를 계산하고, 입력된 버퍼 영역의 비율에 따라 버퍼 영역의 오르락 내리락을 계산한다.
- VWAP 지수를 계산한다.
- 14주기 MFI 지표를 계산하고 구매와 판매의 마이너스를 설정한다.
- 트렌드 필터로 200 EMA의 고위 시간 주기를 얻습니다.
- 가격 움직임의 연속성을 판단하고, 연속적인 상승 또는 하락의 조건을 충족하는지 확인한다.
- 위 조건들을 종합하여, 구매 신호를 생성하는 조건은: 종결 가격 200 EMA를 돌파하고 VWAP보다 높으며, MFI는 구매 경미치를 초과하고, 종결 가격이 고위 시간 주기 200 EMA보다 높으며, 가격 움직임은 지속적으로 상승한다.
- 판매 신호의 조건은: 종결 가격이 200 EMA 아래로 내려와 VWAP보다 낮고, MFI는 절벽을 판매하기보다 작고, 종결 가격이 200 EMA보다 낮고, 가격 움직임은 지속적으로 떨어진다.
- 구매 또는 판매 조건이 충족될 때, 전략은 상응하는 다목적 또는 공백 거래를 한다.
전략적 이점
- 여러 지표와 결합하여 종합 판단을 통해 가짜 신호를 효과적으로 필터링하여 신호 신뢰도를 향상시킵니다.
- 고급 시간 주기 트렌드 필터를 도입하여 거래 결정을 큰 흐름과 일치시키고 역동적인 거래의 위험을 줄입니다.
- 가격 흐름의 연속성을 판단하여 트렌드 강도를 더욱 확인하고 입시 시기의 정확성을 향상시킵니다.
- 버퍼 구역 개념을 사용하여, 가격의 일정 범위 내에서 변동이 허용되고, 빈번한 거래를 피한다.
- 매개 변수는 조정 가능하며, 다양한 시장과 거래 스타일에 따라 최적화 될 수 있습니다.
전략적 위험
- 위기 시장이나 트렌드 전환점에서는 지표가 가짜 신호를 만들어 손실을 초래할 수 있다.
- 부적절한 매개 변수 설정은 전략의 부적절한 성과를 초래할 수 있습니다. 예를 들어, 방충 구역이 너무 커지면 거래 기회가 놓쳐질 수 있으며 너무 작으면 거래가 자주 발생할 수 있습니다.
- 전략은 역사적 데이터에 의존하여 계산과 판단을 하고 있으며, 급격한 사건이나 블랙 스 사건에 대한 반응이 늦어질 수 있다.
- 일부 특수한 시장 환경에서는, 추세가 극도로 지속되거나 급격하게 변동할 때, 전략이 실패할 수 있다.
전략 최적화 방향
- 매개 변수를 최적화하기 위해, EMA 주기, MFI 주기 및 경량, 완충 구역 크기 등과 같은 매개 변수의 최적의 조합을 찾기 위해 역사 데이터를 재검토 할 수 있습니다.
- 신호의 신뢰성과 안정성을 더 높이기 위해 부린 밴드, RSI 등과 같은 다른 보조 지표 또는 시장 감정 지표를 도입하는 것이 고려 될 수 있습니다.
- 거래 관리의 측면에서, 단일 거래의 위험을 제어하기 위해 모바일 스톱 또는 ATR 기반의 동적 스톱과 같은 스톱 스톱 메커니즘을 도입 할 수 있습니다.
- 다른 포지션 관리 전략을 탐색 할 수 있습니다. 위험 기반의 포지션 사이징이나 케일리 공식과 같은 전략의 위험 수익 비율을 최적화하기 위해.
- 기계 학습 또는 적응 알고리즘을 도입하고, 시장 변화에 적응하기 위해 전략 매개 변수를 동적으로 조정하는 것을 고려하십시오.
요약하다
이 전략은 200일 EMA, VWAP 및 MFI 지표를 결합하여 고위 시간 주기 추세와 가격 움직임의 연속성을 고려하면서 비교적 안정적인 트렌드 추적 거래 시스템을 구축합니다. 전략은 여러 조건의 통합 판단을 통해 거짓 신호를 필터링하여 진입 시기의 정확성을 향상시킵니다. 동시에, 전략의 매개 변수의 유연성은 다른 시장과 거래 스타일에 따라 최적화를 허용합니다. 그러나 전략에는 손실이 발생할 수 있는 위험도 있습니다.
전략 소스 코드
/*backtest
start: 2023-05-08 00:00:00
end: 2024-05-13 00:00:00
period: 1d
basePeriod: 1h
exchanges: [{"eid":"Futures_Binance","currency":"BTC_USDT"}]
*/

//@version=5
strategy("200 EMA, VWAP, MFI Strategy - Visible Signals", overlay=true, pyramiding=0)

// Inputs for dynamic adjustments
buffer = input.float(0.2, title="EMA Buffer Percentage", step=0.1) / 100
higherTimeframe = input.timeframe("15", title="Higher Timeframe")
mfiBuyThreshold = input(60, title="MFI Buy Threshold")
mfiSellThreshold = input(40, title="MFI Sell Threshold")
consecutiveCloses = input.int(1, title="Consecutive Closes for Confirmation")

// Calculate the 200-period EMA
ema200 = ta.ema(close, 200)
emaBufferedHigh = ema200 * (1 + buffer)
emaBufferedLow = ema200 * (1 - buffer)
emaHigher = request.security(syminfo.tickerid, higherTimeframe, ta.ema(close, 200))

// VWAP calculation
vwap = ta.vwap(hlc3)

// Money Flow Index calculation
mfiLength = 14
mfi = ta.mfi(close, mfiLength)

// Plotting the indicators
plot(ema200, title="200 EMA", color=color.blue)
plot(vwap, title="VWAP", color=color.orange)
plot(mfi, title="MFI", color=color.purple)
hline(50, "MFI Reference", color=color.gray, linestyle=hline.style_dashed)
plot(emaHigher, title="Higher TF EMA", color=color.red)

// Price action confirmation
isUpTrend = ta.rising(close, consecutiveCloses)
isDownTrend = ta.falling(close, consecutiveCloses)

// Define entry conditions
longCondition = close > emaBufferedHigh and close > vwap and mfi > mfiBuyThreshold and close > emaHigher and isUpTrend
shortCondition = close < emaBufferedLow and close < vwap and mfi < mfiSellThreshold and close < emaHigher and isDownTrend

// Trading execution
if (longCondition)
    strategy.entry("Buy", strategy.long)

if (shortCondition)
    strategy.entry("Sell", strategy.short)

// Plot shapes for signals
plotshape(series=longCondition, location=location.belowbar, color=color.green, style=shape.labelup, size=size.small, title="Buy Signal", text="Buy")
plotshape(series=shortCondition, location=location.abovebar, color=color.red, style=shape.labeldown, size=size.small, title="Sell Signal", text="Sell")