Hanyue - 다중 EMA, ATR 및 RSI 기반 추세 추종 거래 전략

1
Follow
1781
Followers
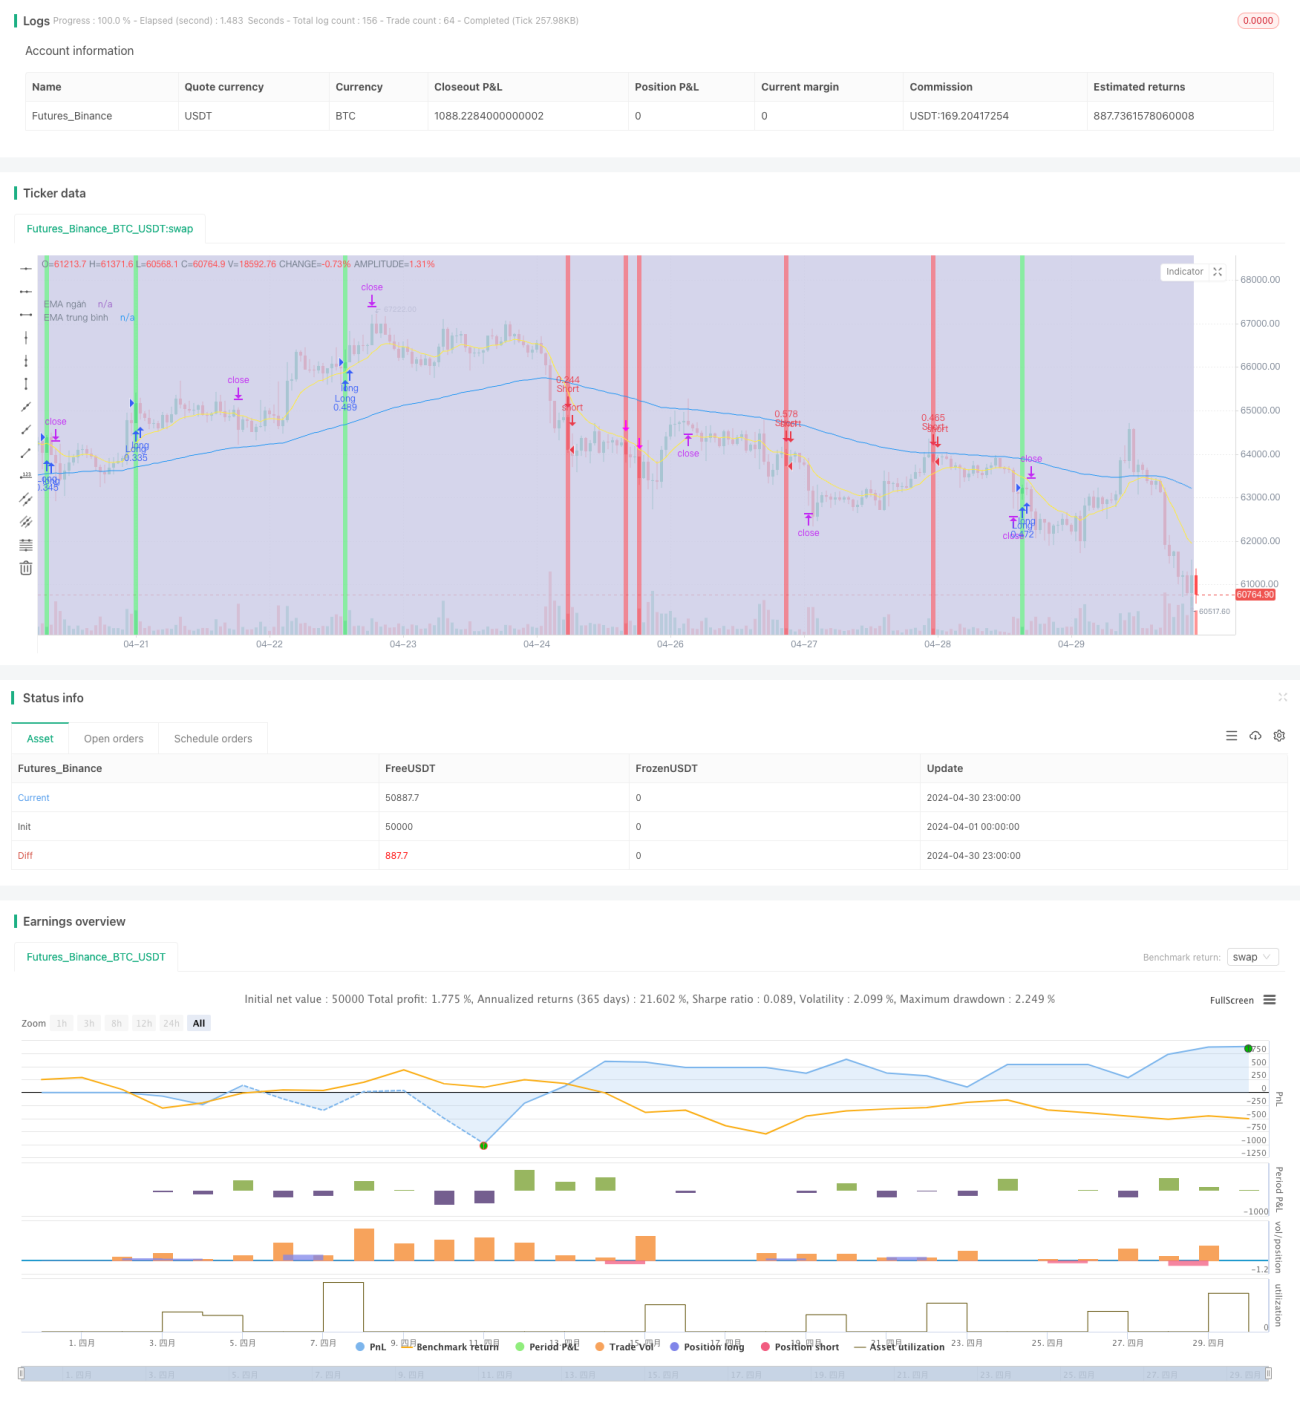
개요
이 전략은 시장의 흐름을 판단하기 위해 3개의 다른 주기의 지수 이동 평균 (EMA) 을 사용하며, 상대적으로 강한 지수 (RSI) 와 평균 실제 파도 (ATR) 를 결합하여 진입점과 정지점을 결정한다. 가격이 3개의 EMA를 형성한 통로를 뚫고 RSI도 이동 평균을 뚫을 때, 전략은 창고 열 신호를 유발한다. 동시에, ATR은 상위 규모를 제어하고 정지점을 설정하는 데 사용되며, 수익 위험 비율 (RRR) 은 정지점을 결정하는 데 사용된다. 이 전략의 주요 장점은 간단하고 효과적이며, 시장의 추세에 따라 거래할 수 있으며, 엄격한 스타일 컨트롤을 통해 잠재적 인 손실을 제한한다.
전략 원칙
- 시장의 전체적인 추세를 판단하기 위해 3개의 다른 주기의 (단기, 중기, 장기) EMA를 계산한다.
- RSI 지표는 트렌드의 강도와 지속성을 확인하기 위해 사용되며, RSI가 이동 평균을 돌파하면 트렌드가 바뀌었다는 것을 나타냅니다.
- 가격과 EMA 채널의 관계를 결합하고 RSI 신호를 생성하여 저장소 신호를 생성합니다: 가격이 EMA 채널을 뚫고 RSI가 이동 평균을 뚫을 때, 트렌드 방향에 따라 저장소가 열립니다.
- ATR을 사용하여 상위권 규모와 스톱로스를 결정하고, 거래 당 리스크 <unk>을 제어한다.
- 기본 수익 리스크 (예: 1.5:1) 에 따라 스톱 포스트를 설정하여 전략의 수익성을 보장합니다.
우위 분석
- 간단하고 효과적입니다. 이 전략은 몇 가지 일반적인 기술 지표만을 사용하며, 논리는 명확하고 이해하기 쉽고 실행할 수 있습니다.
- 추세 따라: EMA 채널과 RSI의 결합을 통해, 전략은 시장 추세에 따라 거래하고, 더 큰 가격 변동을 포착할 수 있다.
- 위험 제어: ATR을 사용하여 스톱 로스를 설정하고 상위 포지션 규모를 제어하여 거래 당 위험 <unk>을 효과적으로 제한합니다.
- 유연성: 전략 매개 변수 (EMA 주기, RSI 주기, ATR 배수 등) 는 다른 시장과 거래 스타일에 따라 조정되어 성능을 최적화 할 수 있습니다.
위험 분석
- 매개 변수 최적화: 전략의 성능은 크게 매개 변수 선택에 달려 있으며, 부적절한 매개 변수 설정으로 인해 전략이 실패하거나 성능이 떨어질 수 있다.
- 시장 위험: 갑작스러운 사건이나 극단적인 상황에서는 전략이 큰 손실을 입을 수 있습니다. 특히 추세 반전이나 흔들리는 시장에서 그렇습니다.
- 지나치게 모의: 변수 최적화 과정에서 지나치게 모의된 역사적 데이터는 실제 거래에서 전략이 좋지 않은 결과를 초래할 수 있다.
개선방향
- 동적 매개 변수: 시장 상태의 변화에 따라 동적 조정 전략 매개 변수, 예를 들어 추세가 분명할 때 더 긴 EMA 주기를 사용하거나, 흔들리는 시장에서 더 짧은 주기를 사용한다.
- 다른 지표를 결합: 다른 기술 지표를 도입 (불린 띠, MACD 등) 하여 창고 신호의 신뢰성과 정확성을 높인다.
- 시장의 감정에 참여: 시장의 감정 지표 (두려움과 탐욕 지표와 같은) 를 결합하여 전략의 위험 틈새 및 저장소 관리를 조정합니다.
- 다중 시간 프레임 분석: 시장의 추세와 신호를 다양한 시간 프레임에서 분석하여 더 포괄적인 시장 관점을 얻고 더 안정적인 거래 결정을 내립니다.
결론
이 전략은 EMA, RSI 및 ATR과 같은 여러 일반적인 기술적 지표를 결합하여 간단한 효과적인 트렌드 추적 거래 시스템을 구축합니다. 그것은 시장의 추세를 판단하기 위해 EMA 통로를 사용하고, RSI를 확인하기 위해 트렌드 강도를 사용하고, ATR을 사용하여 위험을 제어합니다. 전략의 장점은 그것의 단순성과 적응성이라는 것입니다.
Source
Pine
Strategy parameters
Related strategies
Comment
All comments (0)
No data
- 1