볼린저 밴드 ATR 추세 추종 전략

1
Follow
1781
Followers
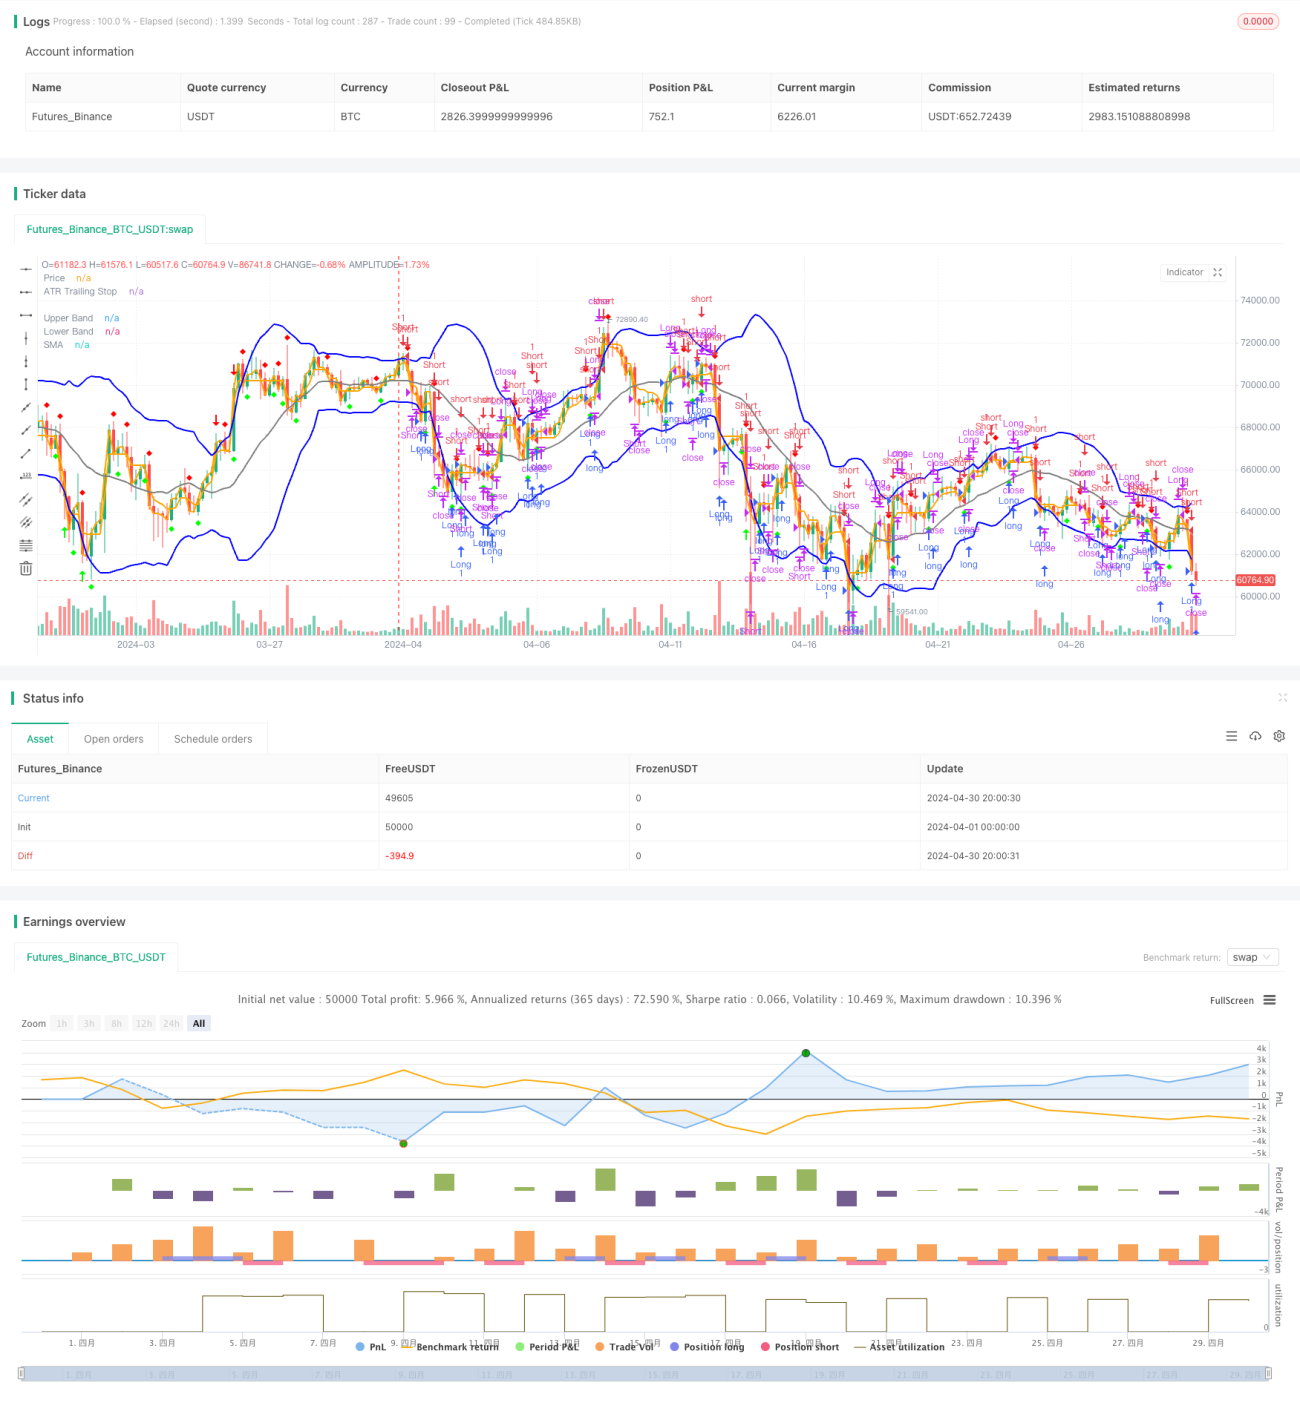
개요
이 전략은 부린 띠와 ATR 지표에 기반을 두고 있으며, 부린 띠를 통해 가격의 변동 범위를 포착하고, 부린 띠를 뚫고 하향 궤도를 타는 것을 포지션 신호로 사용하며, ATR을 이동 스톱으로 사용하며, 마지막으로 간단한 이동 평균을 깨는 것을 포지션 신호로 사용한다. 이 전략은 트렌드 상황을 포착하고, 트렌드 방향에 따라 포지션을 구축하고, 트렌드가 역전될 때 평점 포지션을 취한다.
전략 원칙
- 브린 띠 계산: 종점 가격을 계산하기 위해 간단한 이동 평균 ((SMA) 을 브린 띠의 중간 궤도로 사용하며, 변동률 ((표준 차) 에 따라 궤도 상하를 계산한다.
- ATR 계산: 실제 파장 ((TR) 의 이동 평균을 사용하여 ATR을 계산하고, 이동 중지 손실의 기초로 <unk>.
- 거래 신호를 생성한다: 가격이 아래로 부린을 타면 더 많은 신호를 생성하고, 위쪽으로 부린을 타면 더 많은 신호를 생성한다. 가격이 위쪽으로 ATR을 타면 더 많은 신호를 생성하고, ATR을 타면 더 많은 신호를 생성한다.
- 평소 위치: 다중 위치 할 때, 가격이 상향으로 간단한 이동 평균을 돌파하면 평소; 공백 위치 할 때, 가격이 상향으로 간단한 이동 평균을 돌파하면 공소.
전략적 이점
- 트렌드 추적: 브린 띠와 ATR 이동식 중지 손실을 통해 트렌드 트렌드를 포착하고, 다양한 시장 환경에 적응한다.
- 시간적 중지: ATR을 이동식 중지로 사용하여 시장의 변동에 따라 중지 위치를 동적으로 조정하여 위험을 제어 할 수 있습니다.
- 간단하고 사용하기 쉬운: 명확한 전략 논리, 적은 매개 변수, 이해하기 쉽고 적용하기 쉽다.
전략적 위험
- 매개 변수 민감성: 브린 띠와 ATR의 매개 변수 선택은 전략 성능에 영향을 미치며, 다른 시장과 품종에 따라 최적화가 필요합니다.
- 흔들리는 시장: 흔들리는 시장 환경에서, 거래 신호의 빈도는 거래의 수와 비용을 과도하게 증가시킬 수 있습니다.
- 트렌드 반전: 트렌드가 반전될 때, 전략은 더 큰 반전을 일으킬 수 있다.
전략 최적화 방향
- 매개 변수 최적화: 브린 벨트와 ATR의 매개 변수를 최적화하여 다른 시장과 품종에 적합한 최적의 매개 변수 조합을 찾습니다.
- 필터: 다른 기술 지표 또는 가격 행동 패턴을 필터로 추가하여 잘못된 판단을 줄이고 신호 품질을 향상시킵니다.
- 포지션 관리: 시장의 변동성이나 계좌의 위험에 따라 포지션을 동적으로 조정하여 자금 활용 효율성과 수익 위험 비율을 향상시킵니다.
요약하다
부린띠 ATR 트렌드 추적 전략은 부린띠와 ATR 지표를 통해 트렌드 시장을 포착하며, 트렌드 추적, 시간적 중단 및 간단한 사용의 장점이 있습니다. 그러나 동시에 파라미터 민감성, 변동 시장 및 트렌드 역전과 같은 위험이 있습니다. 파라미터 최적화, 필터 및 포지션 관리 등을 통해 전략 성능을 더욱 최적화 할 수 있습니다.
Source
Pine
Strategy parameters
Related strategies
Comment
All comments (0)
No data
- 1