다이나믹 볼린저 밴드 브레이크아웃 전략

1
Follow
1781
Followers
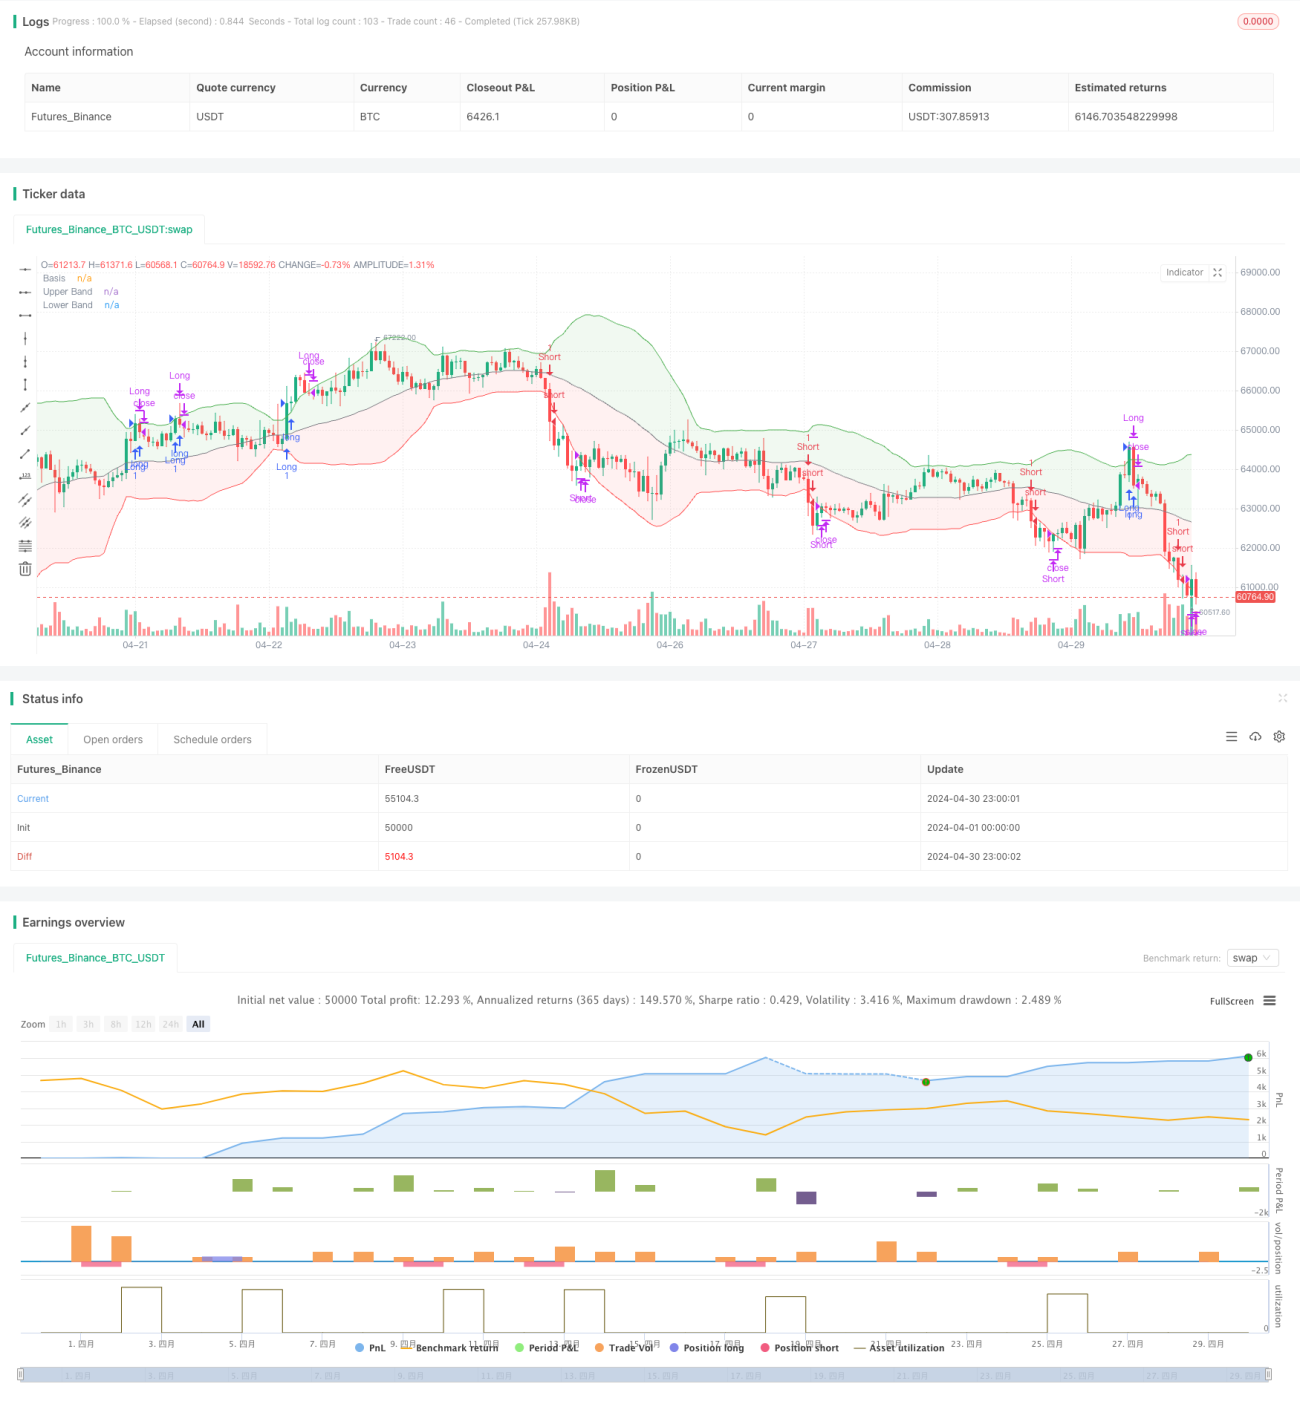
개요
동적 부린 띠 돌파 전략은 부린 띠 지표에 기반한 거래 전략이다. 이 전략은 부린 띠의 상하 궤도를 동적 지지점과 저항점으로 사용하며, 가격이 상하 궤도를 돌파할 때 구매하고, 하하 궤도를 돌파할 때 판매한다. 부린 띠는 중하 궤도 ((이동 평균선), 상하 궤도 ((중하 궤도加 표준 차이의 배수) 와 하하 궤도 ((중하 궤도 감소 표준 차이의 배수) 로 구성되어 있으며, 시장의 변동에 적응하기 위해 동적으로 조정할 수 있다.
전략 원칙
- 브린 띠의 중도, 상도, 하도 를 계산한다. 중도 는 종전 가격의 간단한 이동 평균, 상도 는 중도 더하기 표준 차이의 배수, 하도 는 중도 빼기 표준 차이의 배수이다.
- 가격이 부린을 가로질러 올라갈 때, 더 많은 포지션을 열고, 가격이 부린을 가로질러 내려갈 때, 빈 포지션을 열습니다.
- 다중 포지션이 존재할 때, 가격이 부린을 가로질러 올라간다면 다중 포지션을 평행한다.
전략적 이점
- 브린 띠는 동적으로 조정할 수 있고, 다양한 시장 변동 상황에 적응할 수 있으며, 어느 정도 자기 적응력을 가지고 있다.
- 전략의 논리는 명확하고, 이해하기 쉽고, 구현하기 쉽습니다.
- 브린 띠는 시장의 유동성이 강할 때 효과가 더 좋으며, 유행을 효과적으로 포착할 수 있다.
전략적 위험
- 시장의 큰 변동과 동향의 흔들림이 있을 때, 이 전략은 거래의 빈도와 거래 비용의 증가로 이어질 수 있다.
- 브린带参数 (如移动平均周期和标准差倍数) 의 선택은 전략의 성능에 영향을 미치며, 다른参数은 다른 결과를 가져올 수 있다.
- 이 전략은 다른 기술적 지표나 기본적 요소를 고려하지 않고 가격과 브린의 관계에 의존하는 거래 결정을 내리고, 단일 신호로 인한 위험에 직면할 수 있다.
전략 최적화 방향
- 다른 기술 지표 (RSI, MACD 등) 를 필터링 조건으로 도입하여 부린 반도 돌파의 유효성을 확인하고 신호 품질을 향상시킵니다.
- 브린 밴드 파라미터를 최적화하여, 역측량과 파라미터 스캔을 통해 최적의 이동 평균 기간과 표준차이배수 조합을 찾는다.
- 적절한 스톱 로즈와 스톱 스<unk> 레벨을 설정하고 단일 거래 위험과 수익 목표를 제어합니다.
- 시장 상태와 변동성을 고려하고, 다른 시장 상태에서 동적으로 조정하는 전략 파라미터 또는 포지션 크기를 <unk>.
요약하다
다이내믹 브린 벨트 브레이크 전략은 브린 벨트 상하의 브레이크를 통해 거래 신호를 생성하는 간단한 거래 전략이다. 이 전략은 추세 시장에서 잘 작동하지만, 불안정한 시장에서 자주 거래하는 문제가 발생할 수 있다. 최적화 방향은 다른 기술 지표와 최적화 매개 변수, 적절한 스톱 스톱을 설정하고 시장 상태에 따라 전략을 조정하는 등이 포함된다. 실제 응용에서는 특정 시장 특성과 개인 위험 선호도에 따라 적절한 조정과 최적화가 필요합니다.
Source
Pine
Strategy parameters
Related strategies
Comment
All comments (0)
No data
- 1