개요
이 전략은 브린 벨트 지표를 기반으로 가격의 상반, 하반, 중반의 움직임에 대한 분석을 통해 최적의 구매 및 판매 기회를 식별합니다. 전략은 다단계 및 빈도 포지션을 동시에 관리하여 다양한 시장 방향에서 수익을 창출할 수 있습니다. 전략의 매개 변수는 다양한 위험 용량과 시장 방식에 맞게 사용자 정의 할 수 있습니다. 전략은 명확한 그래픽 지표와 실시간 구매 및 판매 신호를 제공합니다.
전략 원칙
- 가격이 상하 궤도 또는 중하 궤도를 통과할 때, 구매 신호가 생성되어 상승 추세가 나타날 수 있음을 나타냅니다.
- 가격 하향 또는 중간 경로를 통과하면 판매 신호가 발생하여 하향 추세가 발생할 수 있음을 나타냅니다.
- 가격 하락이 궤도 또는 중간 궤도를 통과 할 때 마이너스 신호를 시작하여 하락하는 시장에서 수익을 얻을 수 있습니다.
- 가격이 하향 또는 중간 경로를 통과 할 때, 평정 포지션 신호를 활성화하여 공백 포지션을 평정하여 이익을 고정하거나 손실을 줄이십시오.
전략적 이점
- 신뢰할 수 있는 기술 분석 원칙에 기초하여 엄격한 테스트를 거쳐 신뢰성과 유효성을 보장합니다.
- 트레이딩 뷰에서 구현하고 사용자 정의하기 쉽고, 모든 수준의 트레이더에게 적합합니다.
- 지속적인 지원과 업데이트를 제공하여 변화하는 시장 조건에 적응하고 전략의 최적의 성능을 유지합니다.
- 동적 입출소를 제공하여 부린에 대한 가격 변화를 분석하여 가장 유리한 시점에 거래가 이루어질 수 있도록 합니다.
- 통합된 다단계 및 공백시장 관리는 시장 추세와 상관없이 모든 방향에서 이익을 얻을 수 있습니다.
전략적 위험
- 불안정한 시장 조건에서, 거래 신호의 빈도는 과도한 거래와 잠재적인 손실을 초래할 수 있습니다.
- 전략은 역사적 데이터와 통계적 분석에 의존하며, 시장의 비합리적인 행동과 블랙 스 사건을 완전히 포착하지 못할 수도 있습니다.
- 잘못된 매개 변수 선택으로 인해 전략이 좋지 않을 수 있습니다. 특정 시장과 거래 스타일에 맞게 매개 변수를 신중하게 최적화하고 재검토해야합니다.
- 모든 시장 조건에서 뛰어난 성과를 낼 수 있는 단일 전략은 없습니다. 브린 벨트 전략은 특정 상황에서 좋지 않은 성과를 낼 수 있으므로 다른 지표 및 위험 관리 기술과 결합하는 것이 좋습니다.
전략 최적화 방향
- RSI, MACD 등과 같은 더 신뢰할 수 있는 거래 신호를 식별하기 위해 더 많은 지표의 조합 논리를 추가하십시오. 이것은 잡음을 필터링하고 잘못된 정보를 줄이는 데 도움이됩니다.
- 시장 상황에 따라 부린 대역의 폭을 조정하는 적응 변동성 계산을 도입하는 것을 고려하십시오. 이것은 다양한 변동률 환경에서 기회를 더 잘 포착 할 수 있습니다.
- ATR 또는 퍼센티지 기반의 스톱 및 스톱 메커니즘을 적용하여 위험을 더 잘 관리하고 수익을 보호합니다. 이것은 잠재적인 손실을 제한하고 달성 된 수익을 잠금하는 데 도움이됩니다.
- 시장 주기와 변동률 상태에 기반한 역동적인 포지션 조정을 탐구한다. 다양한 시장 상황에 따라 자본을 배분하여 위험 조정 후 수익을 최적화 할 수 있다.
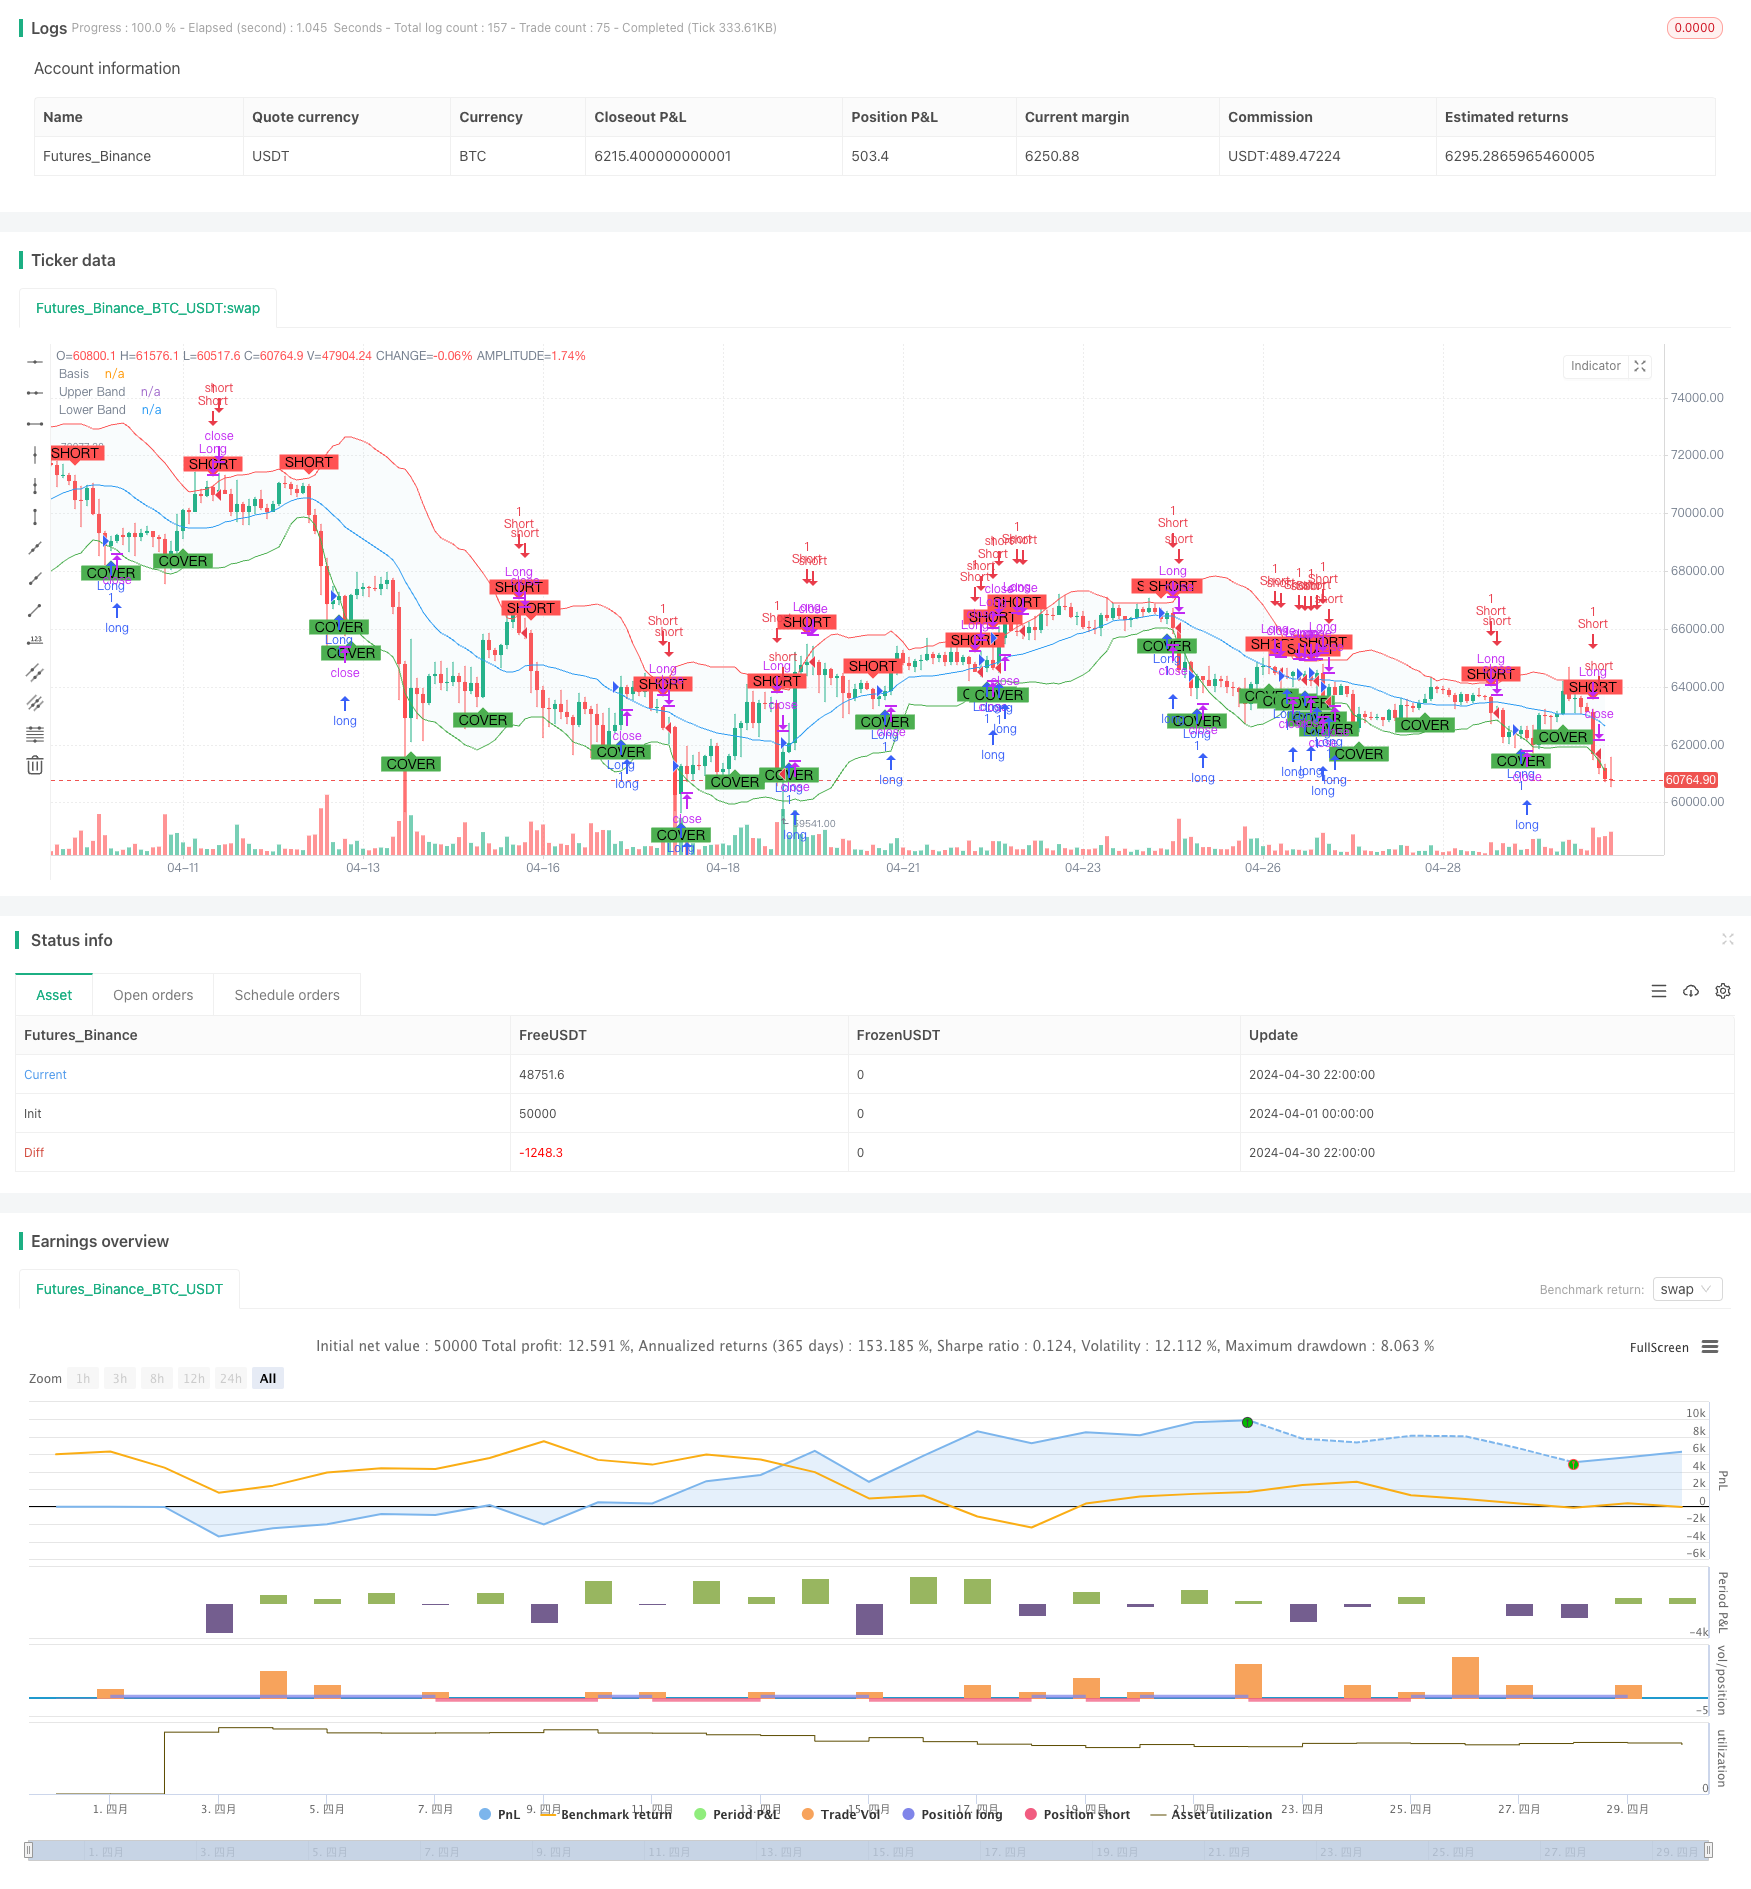
요약하다
브린밴드 전략은 가격에 대한 브린밴드 움직임에 기반한 정확한 거래 신호를 생성하는 강력한 프레임워크를 제공합니다. 다중 및 공수 포지션 관리, 사용자 정의 파라미터 및 직관적인 시각 및 상기 기능을 통합하여, 이 전략은 거래자가 다양한 시장 조건에서 기회를 자신있게 잡을 수 있도록합니다. 이 전략은 훌륭한 성과에도 불구하고, 추가 지표, 동적 변동율 계산, 강력한 위험 관리 기술 및 시장 상태에 기반한 적응 포지션 조정 등의 최적화 공간이 있습니다.
전략 소스 코드
/*backtest
start: 2024-04-01 00:00:00
end: 2024-04-30 23:59:59
period: 2h
basePeriod: 15m
exchanges: [{"eid":"Futures_Binance","currency":"BTC_USDT"}]
*/

//@version=5
strategy("Bollinger Bands Strategy with Long and Short", overlay=true)

// Bollinger Bands settings
length = input.int(20, title="BB Length")
src = input(close, title="Source")
mult = input.float(2.0, title="BB Multiplier")

// Calculate Bollinger Bands
basis = ta.sma(src, length)
dev = mult * ta.stdev(src, length)
upper = basis + dev
lower = basis - dev

// Plot Bollinger Bands
plot(basis, color=color.blue, linewidth=1, title="Basis")
p1 = plot(upper, color=color.red, linewidth=1, title="Upper Band")
p2 = plot(lower, color=color.green, linewidth=1, title="Lower Band")
fill(p1, p2, color=color.rgb(173, 216, 230, 90))

// Long Buy and Sell conditions
buyConditionLower = ta.crossover(src, lower)
sellConditionUpper = ta.crossunder(src, upper)
buyConditionBasis = ta.crossover(src, basis)
sellConditionBasis = ta.crossunder(src, basis)

// Combine long conditions
buyCondition = buyConditionLower or buyConditionBasis
sellCondition = sellConditionUpper or sellConditionBasis

// Short Sell and Buy conditions
shortConditionUpper = ta.crossunder(src, upper)
coverConditionLower = ta.crossover(src, lower)
shortConditionBasis = ta.crossunder(src, basis)
coverConditionBasis = ta.crossover(src, basis)

// Combine short conditions
shortCondition = shortConditionUpper or shortConditionBasis
coverCondition = coverConditionLower or coverConditionBasis

// Execute strategy orders for long
if (buyCondition)
    strategy.entry("Long", strategy.long)
if (sellCondition)
    strategy.close("Long")

// Execute strategy orders for short
if (shortCondition)
    strategy.entry("Short", strategy.short)
if (coverCondition)
    strategy.close("Short")

// Plot Buy and Sell signals for long
plotshape(series=buyCondition, location=location.belowbar, color=color.green, style=shape.labelup, text="BUY", title="Buy Signal")
plotshape(series=sellCondition, location=location.abovebar, color=color.red, style=shape.labeldown, text="SELL", title="Sell Signal")

// Plot Sell and Cover signals for short
plotshape(series=shortCondition, location=location.abovebar, color=color.red, style=shape.labeldown, text="SHORT", title="Short Signal")
plotshape(series=coverCondition, location=location.belowbar, color=color.green, style=shape.labelup, text="COVER", title="Cover Signal")

// Alert conditions for long
alertcondition(buyCondition, title="Buy Alert", message="Price crossed above the lower Bollinger Band or Basis")
alertcondition(sellCondition, title="Sell Alert", message="Price crossed below the upper Bollinger Band or Basis")

// Alert conditions for short
alertcondition(shortCondition, title="Short Alert", message="Price crossed below the upper Bollinger Band or Basis")
alertcondition(coverCondition, title="Cover Alert", message="Price crossed above the lower Bollinger Band or Basis")