동적 MACD 및 이치모쿠 킨코 효 트레이딩 전략

1
Follow
1781
Followers
개요
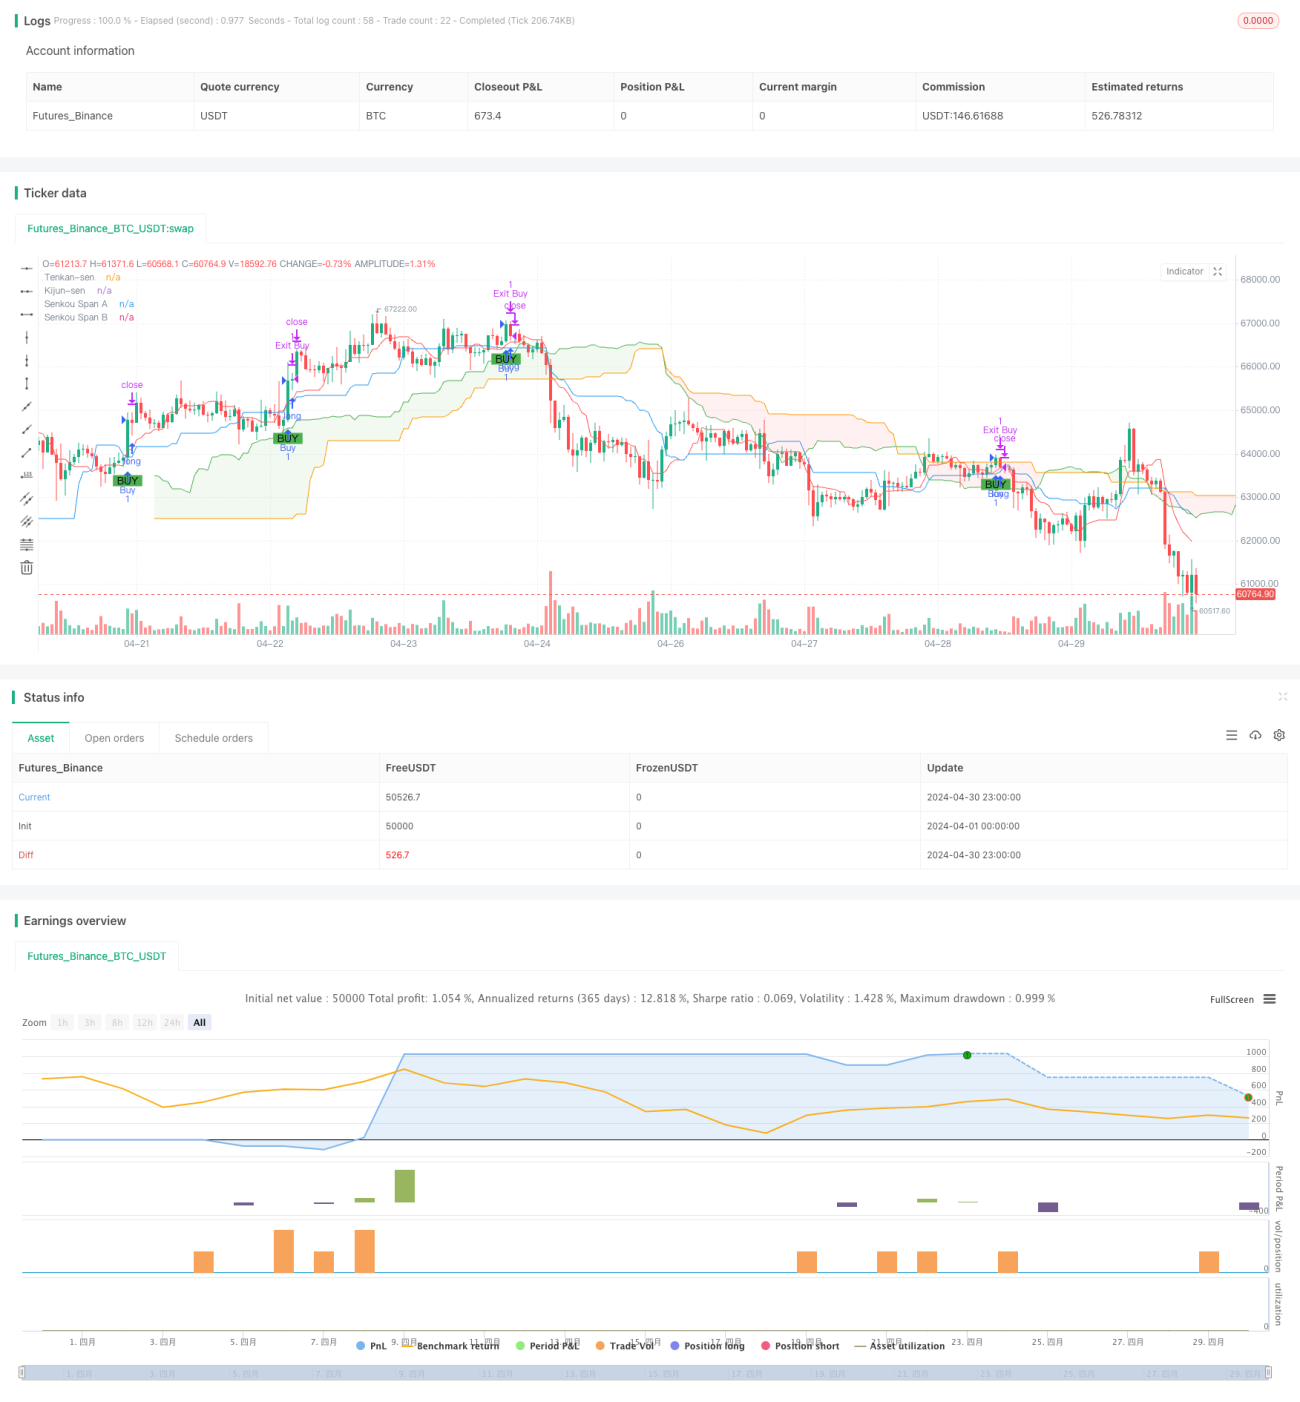
이 거래 전략은 MACD와 1차 균형 도표의 두 가지 기술 지표를 결합하여 중간 트렌드 및 동력 변화를 캡처합니다. MACD 지표는 빠른, 느린 및 신호 라인을 구성하고 각각 12, 26 및 9의 파라미터 설정을 사용하여 동력 변화와 트렌드 반전을 식별합니다. 1차 균형 도표는 전환 라인, 기준 라인, 선행 상위 및 선행 하위, 트렌드 강도 및 방향 및 지지 / 저항 지점에 대한 통찰력을 제공합니다.
전략 원칙
이 전략은 MACD 지표와 1차 균형 차트 클라우드를 사용하여 구매 및 판매 신호를 생성한다. 가격이 1차 균형 차트 클라우드를 초과하고 MACD 라인에서 신호선을 통과하면 구매 신호를 유발하여 부향 경향을 나타냅니다. 가격이 1차 균형 차트 클라우드를 초과하고 MACD 라인 아래에 신호선을 통과하면 판매 신호를 유발하여 하향 경향을 나타냅니다.
전략적 이점
- MACD와 일회성 도표의 결합으로 두 가지 강력한 기술 지표가 더 포괄적이고 신뢰할 수 있는 거래 신호를 제공합니다.
- 중기 거래, 트렌드 포착, 동력 변화 등에 적합하다.
- 명확하게 정의된 구매 및 판매 기준, 이해하기 쉽고 실행하기 쉬운
- 리스크 관리 지침을 포함하고, 스톱로스 및 스톱<unk>을 설정하여 자금을 보호한다.
- 개인 거래 스타일과 주식 특성에 따라 최적화 및 맞춤화가 권장됩니다.
전략적 위험
- MACD와 일차 균형 차트 파라미터는 모든 시장 조건과 주식에 적용되지 않을 수 있다.
- 변동성 시장에서, 거래 신호의 빈도는 과도한 거래와 수수료 손실을 초래할 수 있습니다.
- 손해 중지 위치 잘못 설정되면, 조기 중단 또는 과도한 위험을 수반할 수 있다.
- 이 전략은 역사적인 데이터에 의존하여 미래의 가격 움직임을 정확하게 예측할 수 없습니다.
전략 최적화 방향
- 다른 주식과 시장 조건에 따라 MACD와 1차 균형 도표 파라미터를 조정한다.
- 다른 기술 지표들을 도입하여, 상대적 강도 지수 (RSI) 또는 평균 실제 범위 (ATR) 를 도입하여 신호 품질을 개선한다.
- 위험 관리와 수익을 극대화하기 위해 스톱 로즈와 스톱 <unk>을 최적화하십시오.
- 기술 분석을 보완하기 위해 시장 감정과 기본 요소를 고려하십시오.
요약하다
동적 MACD와 일회성 차트 트레이딩 전략은 두 가지 널리 알려진 기술 지표와 결합하여 중기 경향과 동력 변화를 식별하는 강력한 방법을 제공합니다. 명확하게 정의된 구매 및 판매 기준과 위험 관리 지침을 통해 거래자가 현명한 결정을 내리고 위험을 통제하고 수익을 극대화하도록 돕는 것을 목표로합니다. 그러나 거래자는 자신의 거래 스타일과 시장 특성에 따라 전략을 최적화하고 맞춤화하고 지속적으로 그 성능을 모니터링해야합니다. 적절한 조정과 위험 관리로 전략은 거래자의 도구 상자에 귀중한 보완이 될 수 있습니다.
Source
Pine
Related strategies
Comment
All comments (0)
No data
- 1