원 클라우드 멀티플 이동 평균 거래 전략

1
Follow
1781
Followers
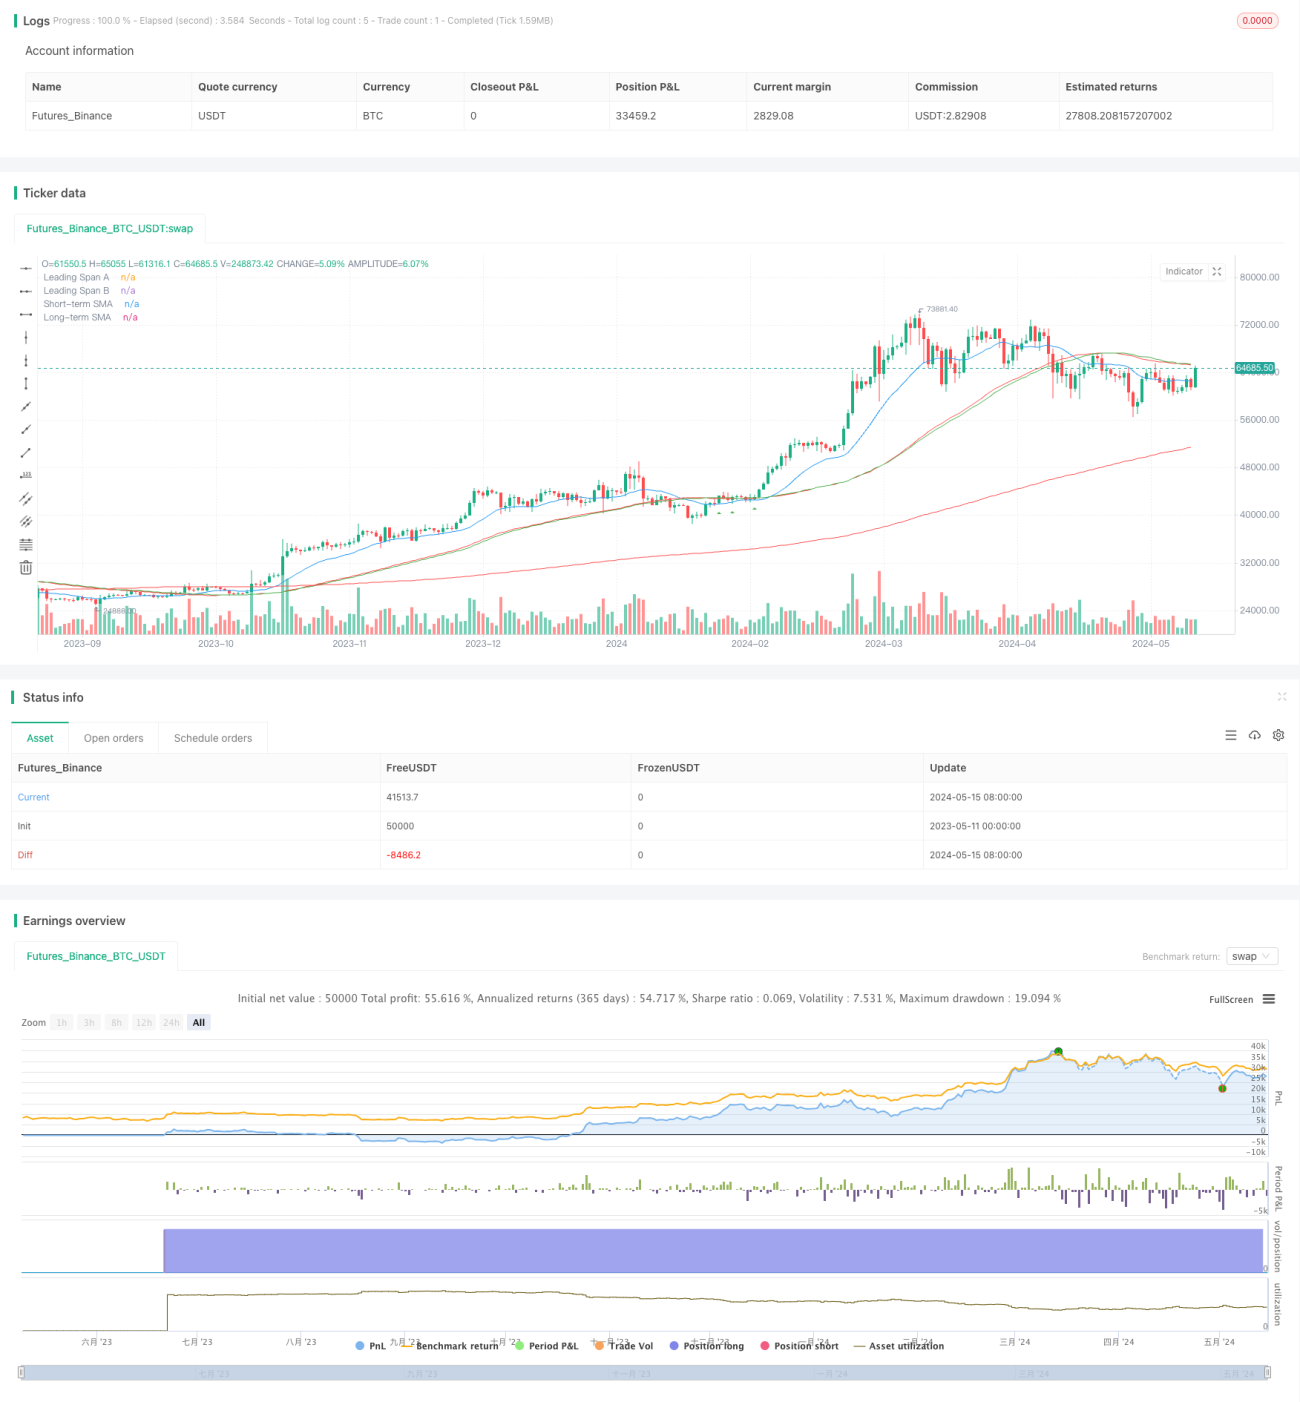
개요
이 전략은 잠재적인 구매/판매 신호를 식별하기 위해 초점 평형 그래프 클라우드와 단기 ((55)) 와 장기 ((200)) 간단한 이동 평균 ((SMA) 를 결합한다. 구매 신호는 클라우드와 장기 SMA보다 높고, 상단 SMA를 통과한 후 다시 단기 SMA를 통과해야 한다. 판매 신호는 클라우드와 장기 SMA를 통과한 후 다시 단기 SMA를 통과해야 한다.
전략 원칙
이 전략은 다음과 같은 원칙에 기초하고 있습니다.
- 가격이 클라우드 및 장기 SMA보다 높을 때 시장은 상승 추세에 있습니다.
- 가격이 클라우드 및 장기 SMA보다 낮을 때 시장은 하향 경향에 있습니다.
- 단기 SMA의 상하하가 트렌드를 확인하고, 단기 SMA를 뒤로 돌리는 것은 낮은 위험으로 진입할 기회를 제공한다.
- 위시장과 주요 뉴스 이벤트 중에는 가짜 신호가 많이 발생하고 거래는 피해야 합니다.
프로그램은 먼저 필요한 1차 클라우드 컴포넌트를 계산한다 (변환선, 기준선, 선행 스파인 A와 B), 그리고 단기 및 장기 SMA를. 그리고 가격의 클라우드 및 평행선에 대한 위치를 식별하기 위해 여러 조건을 정의한다. 모든 구매/판매 조건이 충족되면, 프로그램은 각각 구매 및 판매 신호를 발생시킨다.
전략적 이점
- 여러 지표가 결합되어 트렌드를 확인하여 신호의 신뢰성을 높인다. 초시적인 구름은 많은 잡음을 필터링할 수 있고, SMA 교차는 트렌드를 확인할 수 있다.
- 확인된 트렌드에서 다시 평균선으로 진입할 기회를 찾는 위험은 상대적으로 낮습니다.
- 위조 신호의 위험을 더욱 낮출 수 있는 방법은 상장시장과 주요 뉴스 이벤트 중에 거래하는 것을 피하는 것입니다.
- 1시간, 2시간 등의 중장기 거래에 적합하며, 큰 트렌드를 파악하여 큰 수익을 얻을 수 있다.
전략적 위험
- 트렌드 전환 시에는 손실이 발생할 수 있다. 평평선 교차와 구름층 돌파가 트렌드를 확인하는 데에도 불구하고 지연성은 여전히 존재한다.
- 명확한 정지 위치의 부재. 현 조건은 주로 출전 시점에 초점을 맞추고 있지만, 구체적인 출전 위치를 정의하지 않는다.
- 매개 변수 선택은 주관적이고 불확실하다. 클라우드 매개 변수, 평균선 길이 등과 같은 다른 선택은 전략 성과에 영향을 미칩니다.
전략 최적화 방향
- 단편 거래 위험을 줄이기 위해 브레이크 전 낮은 / 전 높은, ATR 배수 등과 같은 명확한 중지 위치를 추가하십시오.
- MACD, DMI 등과 같은 다른 트렌드 확인 지표와 비교하여 더 안정적이고 신뢰할 수있는 신호 조합을 형성합니다.
- 매개 변수를 최적화하여 최적의 매개 변수 조합을 찾고, 다양한 시장 상태에서 전략의 적응성을 향상시킵니다.
- 트렌드 시장과 흔들림 시장을 구분하고, 트렌드 시장에서 적극적으로 입점하고, 흔들림 시장에서 거래 주파수를 적절히 줄인다.
요약하다
이 "한 구름 다중 평평선 거래 전략"은 일회성 차트 구름과 간단한 이동 평균을 결합하여, 이미 확립된 추세에서 반등 평평선으로의 낮은 위험 진입 기회를 찾습니다. 이 전략은 가로수지 시장과 주요 뉴스 이벤트 기간 동안의 거래를 필터링하여 가짜 신호 위험을 줄여서 전반적인 성능을 향상시킬 수 있습니다. 이 전략은 주로 1시간과 2시간 등의 시간 프레임에서 좋은 성능을 보이는 중장기 거래자에게 적합합니다.
Source
Pine
Strategy parameters
Related strategies
Comment
All comments (0)
No data
- 1