RSI와 MACD를 결합한 롱숏 전략

1
Follow
1781
Followers
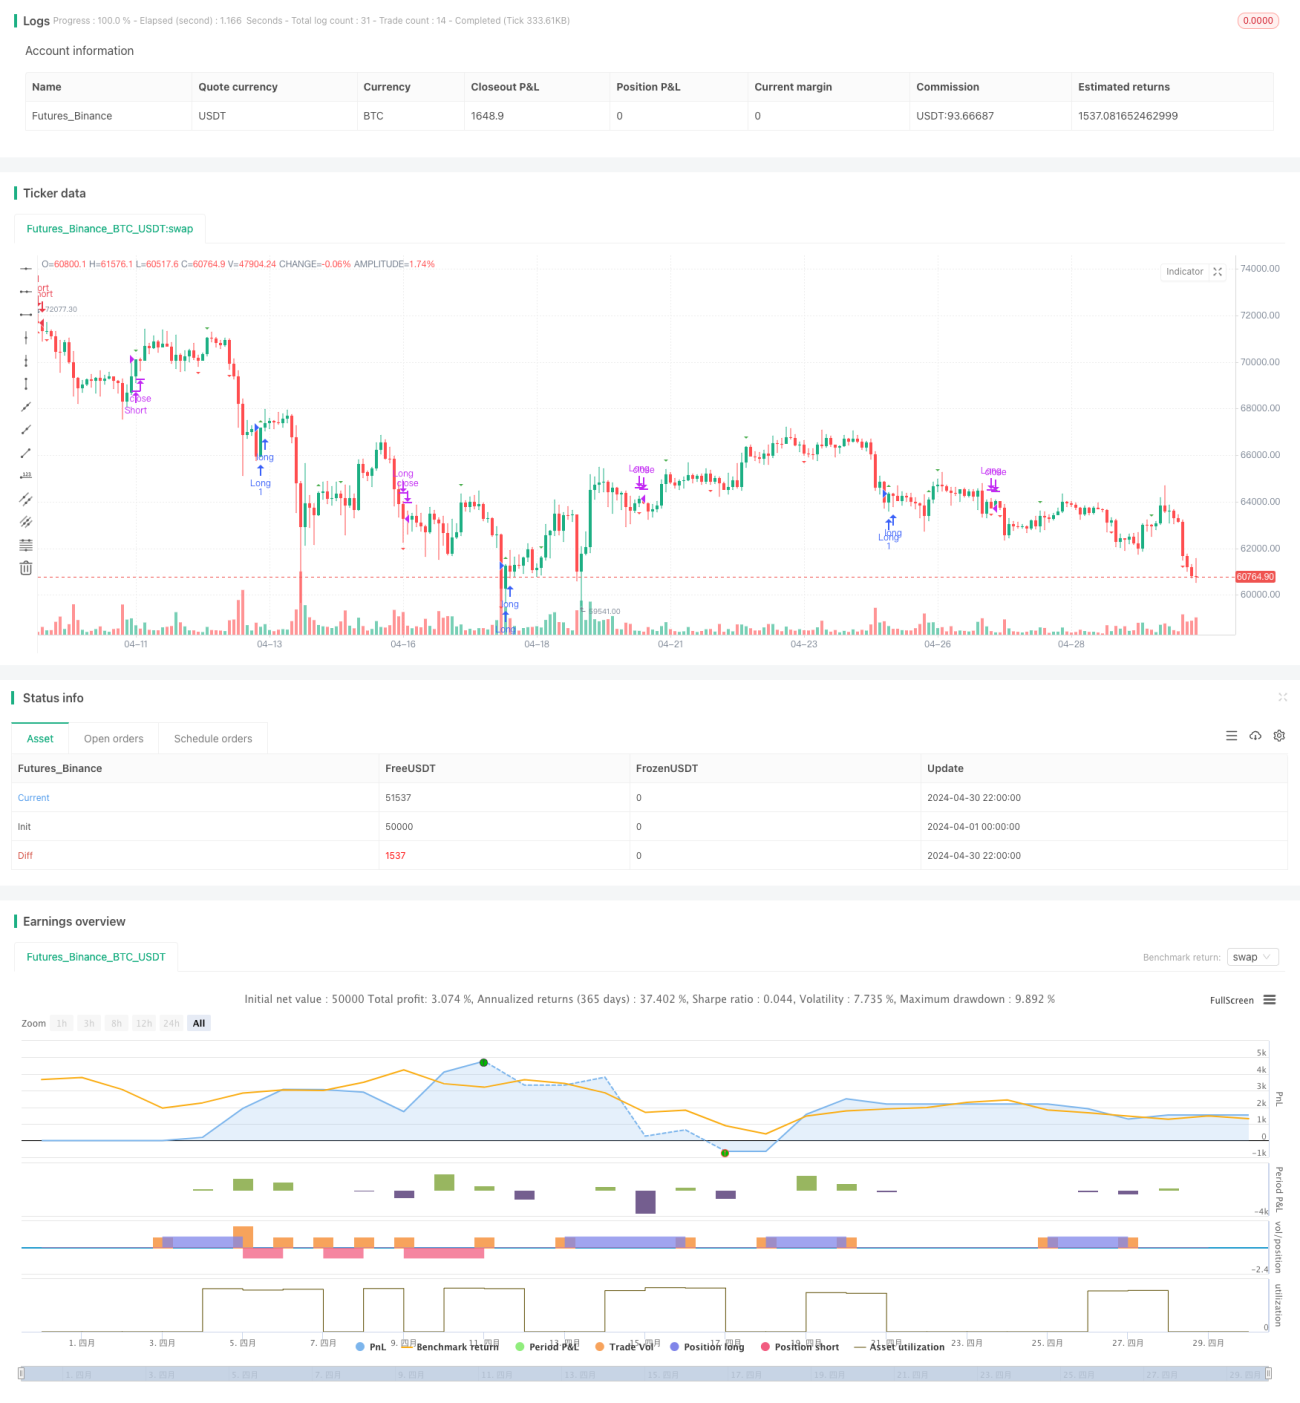
개요
이 전략은 상대적으로 강하고 약한 지수 ((RSI) 와 이동 평균 분산 지수 ((MACD) 의 두 가지 기술 지표를 결합하여 RSI를 사용하여 과매매를 판단하고 MACD는 트렌드 방향을 판단하여 전체 다중 포지션 전략을 형성합니다. RSI가 과매를 할 때 판매 신호를 발산하면 MACD는 빠른 느린 선을 넘어서 상향 평정; RSI가 과매를 할 때 구매 신호를 발산하면 MACD는 빠른 느린 선을 넘어서 상향 평정.
전략 원칙
- RSI를 계산하여 과매매를 판단합니다.
- RSI가 70보다 크고 70선을 상향 하향으로 통과하면 팔기 신호를 발산합니다.
- RSI가 30보다 작고 30선을 아래에서 위로 넘어가면 구매 신호를 발송합니다.
- 트렌드 방향을 판단하기 위한 MACD 지표 계산:
- MACD 패스트 라인이 슬로우 라인을 아래에서 위로 넘어가면, 평점으로 팔라는 신호가 발송됩니다.
- MACD 패스트 라인이 상향에서 하향으로 패스트 라인을 통과할 때, 평준상승을 위한 신호를 발산합니다.
- 스톱포인트 설정:
- 이 품종의 평균 상승과 하락을 계산하고, 그 절반을 스톱포인트로 가져옵니다.
RSI를 통해 과매매 상황을 판단하고, 시장이 반전 초기에는 개입한다. MACD를 사용하여 트렌드 방향을 판단하고, 트렌드 초기에는 평점으로, 트렌드를 더 잘 파악할 수 있다. 두 지표는 서로 보완하여 완전한 거래 시스템을 형성한다.
전략적 이점
- 과매매와 트렌드 추적의 두 가지 전략이 결합되어, 시장의 역전 초기 개입을 할 수 있으며, 추세가 형성 된 후 적시에 평지, 시장의 반복적인 흔들림으로 인한 손실을 효과적으로 피할 수 있습니다.
- 정지점의 설정은 품종에 따라 변동하는 특성을 기반으로, 회수를 제어하고, 자금 활용 효율을 높일 수 있다.
- 코드 논리는 명확하고, 함수화된 프로그래밍 방식을 사용해서 이해하기 쉽고, 최적화하기 쉽습니다.
전략적 위험
- RSI와 MACD 파라미터의 선택은 전략 성능에 큰 영향을 미치며, 다른 품종과 주기에는 파라미터 최적화가 필요할 수 있다.
- 급격한 변동으로 인한 급격한 변동으로 인한 급격한 변동으로 인한 급격한 변동으로 인한 급격한 변동으로 인한 급격한 변동으로 인한 급격한 변동으로 인한 급격한 변동으로 인한 급격한 변동으로 인한 급격한 변동으로 인한 급격한 변동으로 인한 급격한 변동으로 인한 급격한 변동으로 인한 급격한 변동으로 인한 급격한 변동으로 인한 급격한 변동으로 인한 급격한 변동으로 인한 급격한 변동으로 인한 급격한 변동으로 인한 급격한 변동으로 인한 급격한 변동으로 인한 급격한 변동으로 인한 급격한 변동으로 인한 급격한 변동으로 인한 급격한 변동으로 인한 급격한 변동으로 인한 급격한 변동으로 인한 급격한 변동으로 인한 급격한 변동으로 인한 급격한 변동으로 인한 급격한 변동으로 인한 급격한 변동으로 인한 급격한 변동으로 인한 급격한 변동으로 인한 급격한 변동이 발생할 수 있습니다.
- 이 전략은 불안정한 시장에서 잘 작동하지 않을 수 있으며, 거래가 자주 발생하여 거래 비용이 더 높을 수 있습니다.
전략 최적화 방향
- RSI와 MACD의 파라미터를 최적화하여 현재 품종과 주기에서 가장 적합한 파라미터 조합을 찾아 전략의 안정성과 수익성을 향상시킵니다.
- 거래량, 변동성 등과 같은 더 많은 필터링 조건을 추가하여 거래 빈도를 줄이고 신호 품질을 향상시킵니다.
- 포지션 관리 모듈을 도입하여 시장 추세와 자신의 성과에 따라 포지션을 조정하고 철수를 제어합니다.
- 트렌드 추적, 평균 회귀 등과 같은 다른 전략과 결합하여 다중 전략 포트폴리오를 형성하여 전략 적응력을 향상시킵니다.
요약하다
이 전략은 RSI가 과매매를 판단하고 MACD는 트렌드 방향을 판단하여 전체적인 다중 포지션 거래 시스템을 형성한다. 전략 논리는 명확하고 장점은 분명하며, 또한 위험이 존재한다. 매개 변수 최적화, 필터 조건, 포지션 관리 및 다른 전략과 결합하는 방법으로 전략의 성능을 더욱 향상시킬 수 있으며, 안정적인 거래 전략이 될 수 있다.
Source
Pine
Related strategies
Comment
All comments (0)
No data
- 1