가격 거래량 돌파 매수 전략

1
Follow
1781
Followers
개요
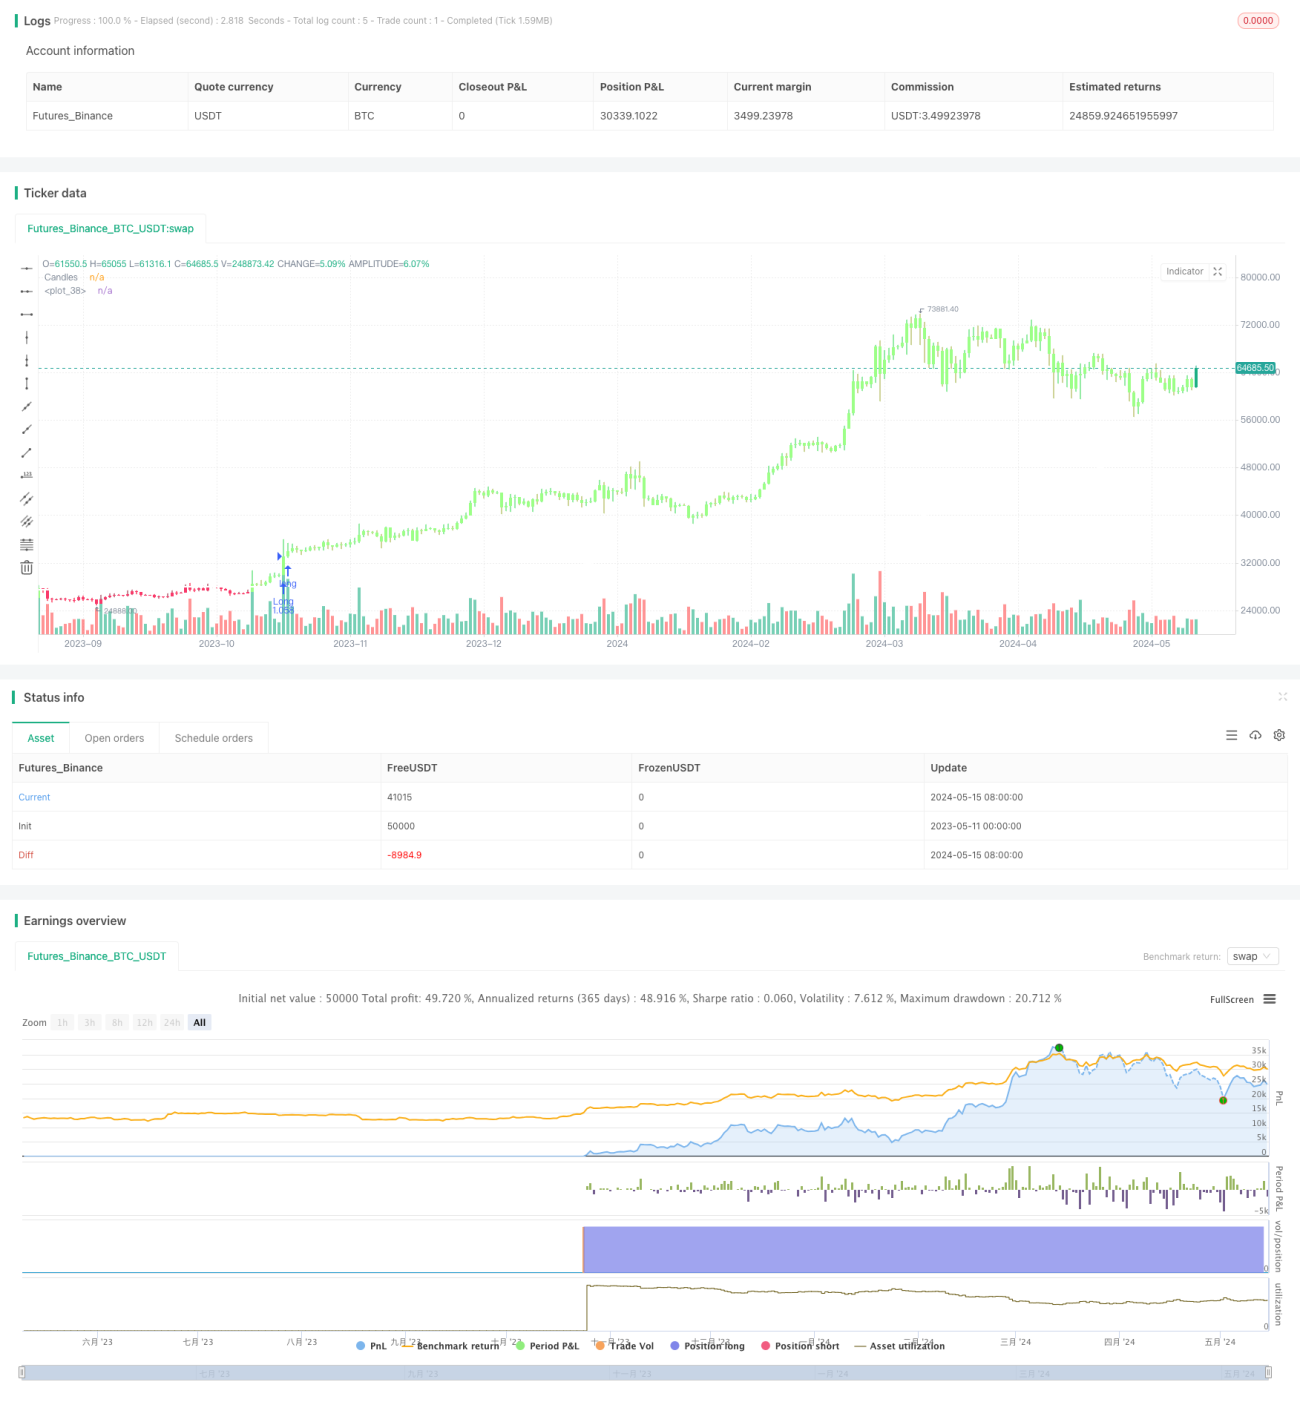
"가격 돌파구 구매 전략"은 지정된 도표 범위 내에서 가격과 거래량 돌파구가 동시에 발생하는 것을 탐지하여 구매 기회를 식별하기 위한 거래 전략이다. 이 전략은 먼저 특정 수의 돌파구를 가격과 거래량 검사 창으로 사용한다. 이러한 값은 돌파구 조건을 식별하는 기준으로 사용됩니다.
전략 원칙
- 가격 돌파구와 거래량 돌파구를 검사 창으로 설정하십시오.
- 가격 돌파 기간 동안의 최고 가격과 최저 가격을 얻습니다.
- 거래량 돌파 기간 동안 가장 많은 거래량을 얻습니다.
- 만약 종결 가격이 전주기의 최고 가격보다 높고, 거래량이 전주기의 최고 거래량보다 높고, 종결 가격이 트렌드 라인 길이의 간단한 이동 평균 (SMA) 보다 높고, 현재는 어떤 포지션 개시 거래도 없고, 주문 방향 설정이 공백이 아닌 경우, 더 많이 하기 시작합니다.
- 5일 연속으로 마감 가격이 트렌드 라인 길이보다 낮은 SMA를 기록하면 모든 상위 포지션을 평행한다.
- 만약 종결 가격이 전주기의 최저 가격보다 낮고, 거래량이 전주기의 최고 거래량보다 높고, 종결 가격이 트렌드 라인 길이의 SMA보다 낮고, 현재 포지션 개시 거래가 없으며, 주문 방향 설정이 더 많이 하지 않은 경우, 공백을 시작합니다.
- 5일 연속으로 종결 가격이 트렌드 라인 길이를 초과하는 SMA가 발생하면 모든 공백 포지션을 청산한다.
전략적 이점
- 가격과 거래량 돌파구를 구매/판매 신호로 사용하여 트렌드 전환을 더 잘 확인할 수 있습니다.
- 포지션을 개시하기 전에 거래가 주요 시장 추세에 부합하는지 확인하기 위해 가격이 장기 SMA보다 높거나 낮지 여부를 확인합니다.
- SMA를 가로질러 연속적으로 다중일 마감값을 설정하여 마감 신호로 설정하면 트렌드의 끝을 효과적으로 잡을 수 있습니다.
- 비트코인과 이더리움과 같은 매우 변동적인 자산에 적용되며, 시장의 급격한 가격과 거래량 변화를 활용하여 수익을 창출할 수 있다.
전략적 위험
- 시장의 변동이 작거나 명백한 추세가 없는 경우, 이 전략은 거래의 빈번함을 초래하여 거래 비용을 증가시킬 수 있다.
- 스탠퍼드 500 지수와 같은 덜 변동적인 시장에서는, 이 전략의 효과는 암호화폐 시장보다 덜 뚜렷할 수 있다.
- 이 전략은 더 높은 시간 프레임에서 더 적은 거래 신호를 생성할 수 있습니다. 왜냐하면 대부분의 거래는 더 긴 보유 기간을 갖는 경향이 있기 때문입니다.
전략 최적화 방향
- 다른 시장 특성에 따라 가격 돌파구와 거래량 돌파구의 길이를 조정하여 다른 자산의 변동 특성에 맞게 조정하십시오.
- 트렌드 판단의 정확성을 높이기 위해 지수 이동 평균, MACD 등과 같은 다른 트렌드 확인 지표를 사용하십시오.
- 전략에 위험 관리 조치를 포함하십시오. 단편 거래의 위험을 줄이기 위해 스톱 로즈 설정, 포지션 조정 및 기타.
- 장기간 보유한 거래의 경우, 수익을 더 잘 보호하기 위해 이동 중지 전략을 추가하는 것을 고려할 수 있습니다.
요약하다
"가격 돌파구 구매 전략"은 높은 변동성 시장에 적합한 트렌드 추적 전략이다. 가격과 거래량을 동시에 고려하고, 장기 SMA를 트렌드 필터로 결합함으로써, 이 전략은 강세를 보이는 상황에서 거래 기회를 더 잘 포착할 수 있다. 그러나, 이 전략은 추세가 보이지 않는 또는 변동성이 적은 시장에서 좋지 않은 성능을 발휘할 수 있으며, 자주 거래의 위험에 처할 수 있다. 따라서 실제 응용에서는 다양한 시장 특성과 개인 거래 스타일에 따라 이 전략에 대한 적절한 최적화와 조정이 필요하며, 안정성과 수익성을 높일 수 있다.
Source
Pine
Strategy parameters
Related strategies
Comment
All comments (0)
No data
- 1