EMA SAR 중장기 추세 추종 전략

1
Follow
1780
Followers
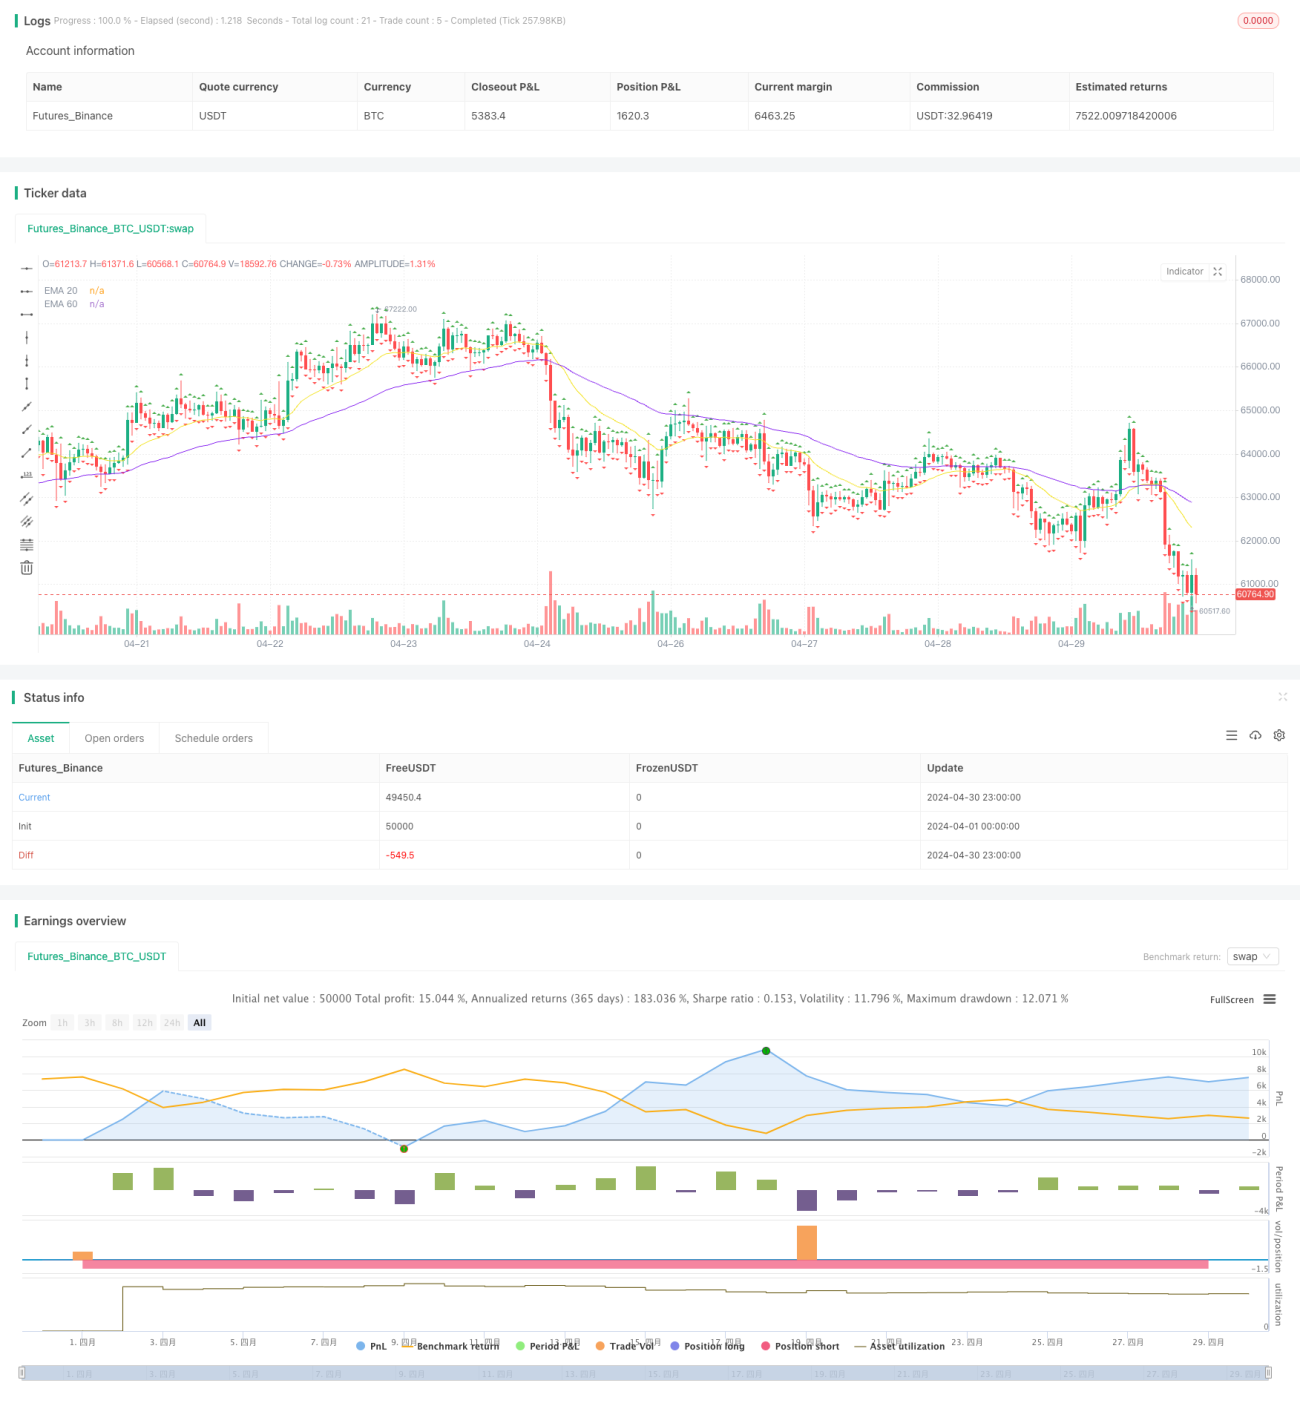
개요
EMA SAR에서의 장기 트렌드 추적 전략은 지수 이동 평균 ((EMA) 과 패러폴리 라인 지표 ((SAR) 의 조합을 사용하여 시장의 중장기 트렌드를 포착하는 양적 거래 전략이다. 이 전략은 20주기 EMA와 60주기 EMA를 비교하여 SAR 지표와 결합하여 현재 시장의 트렌드 방향을 결정하고, 트렌드가 확립된 후에 거래한다. 이 전략의 주요 목표는 트렌드 형성 초기 단계에서 개입하고, 트렌드 반전의 신호가 나타날 때까지 포지션을 보유하는 것이다.
전략 원칙
이 전략의 핵심은 두 개의 다른 주기적 EMA ((20과 60) 의 교차를 사용하여 트렌드의 방향을 판단하는 것입니다. 20주기 EMA가 아래 방향에서 60주기 EMA를 통과하면 상승 트렌드가 형성되고 있음을 나타냅니다. 반대로 20주기 EMA가 위 방향에서 60주기 EMA를 통과하면 하향 트렌드가 형성되고 있음을 나타냅니다. 트렌드의 진실성을 추가로 확인하기 위해 이 전략은 SAR 지표를 보조 판단으로 도입했습니다.
우위 분석
- 이 전략은 EMA와 SAR 지표를 조합하여 노이즈와 가짜 신호를 잘 필터링하여 트렌드 판단의 정확성을 향상시킵니다.
- 이 전략의 거래 빈도는 상대적으로 낮아 중장기적 추세를 포착하는 데 더 적합하며 거래 비용과 거래 빈도의 위험을 줄이는 데 도움이 됩니다.
- 트렌드 형성 초기 단계에 개입하여 각 트렌드의 수익 공간을 극대화 할 수 있습니다.
- 스톱로스는 전날의 하위점 (high) 또는 하위점 (low) 을 설정하여 단일 거래의 위험을 효과적으로 제어할 수 있다.
위험 분석
- 이 전략은 불안한 시장에서 더 많은 잘못된 신호가 발생할 수 있으며, 이로 인해 거래가 빈번하고 자금이 손실됩니다.
- 전략의 성능은 EMA와 SAR 변수의 선택에 크게 의존하며, 다른 변수 설정은 전략의 성능에 큰 차이를 초래할 수 있다.
- 강한 추세 시장에서 이 전략은 EMA와 SAR의 교차 확인을 기다리기 때문에 가장 좋은 진입 기회를 놓칠 수 있다.
- 이 전략은 위험과 수익의 동적인 균형이 부족하며, 각 거래에서 감수되는 위험은 다를 수 있다.
최적화 방향
- 트렌드 판단의 정확성과 신뢰성을 더 높이기 위해 다른 기술 지표 또는 시장 감정 지표를 도입하는 것을 고려하십시오.
- EMA와 SAR의 매개 변수를 최적화하여 다양한 시장 조건에서 가장 잘 작동하는 매개 변수 조합을 찾습니다.
- 동적 스톱 및 스톱 메커니즘을 도입하여 시장의 변동성과 개별 주식의 특성에 따라 실시간으로 위험을 조절합니다.
- 시장 선두 주식이나 산업 회전과 같은 전략과 결합하여 강한 추세 시장에서 적응력과 수익 잠재력을 높여줍니다.
요약하다
EMA SAR에서 장기적인 트렌드 추적 전략은 EMA와 SAR 지표를 조합하여 트렌드 형성 초기 단계에서 개입하여 시장에서 장기적인 트렌드 기회를 포착합니다. 이 전략의 장점은 노이즈를 더 잘 필터링하고 트렌드가 확립된 후 이익을 극대화하기 위해 위치를 유지하는 것입니다. 그러나, 그것은 불안한 시장에서 더 많은 잘못된 신호가 발생할 수 있으며, 선택 지수의 영향을 더 많이 나타냅니다.
Source
Pine
Related strategies
Comment
All comments (0)
No data
- 1