EMA5와 EMA13 크로스오버 전략

개요
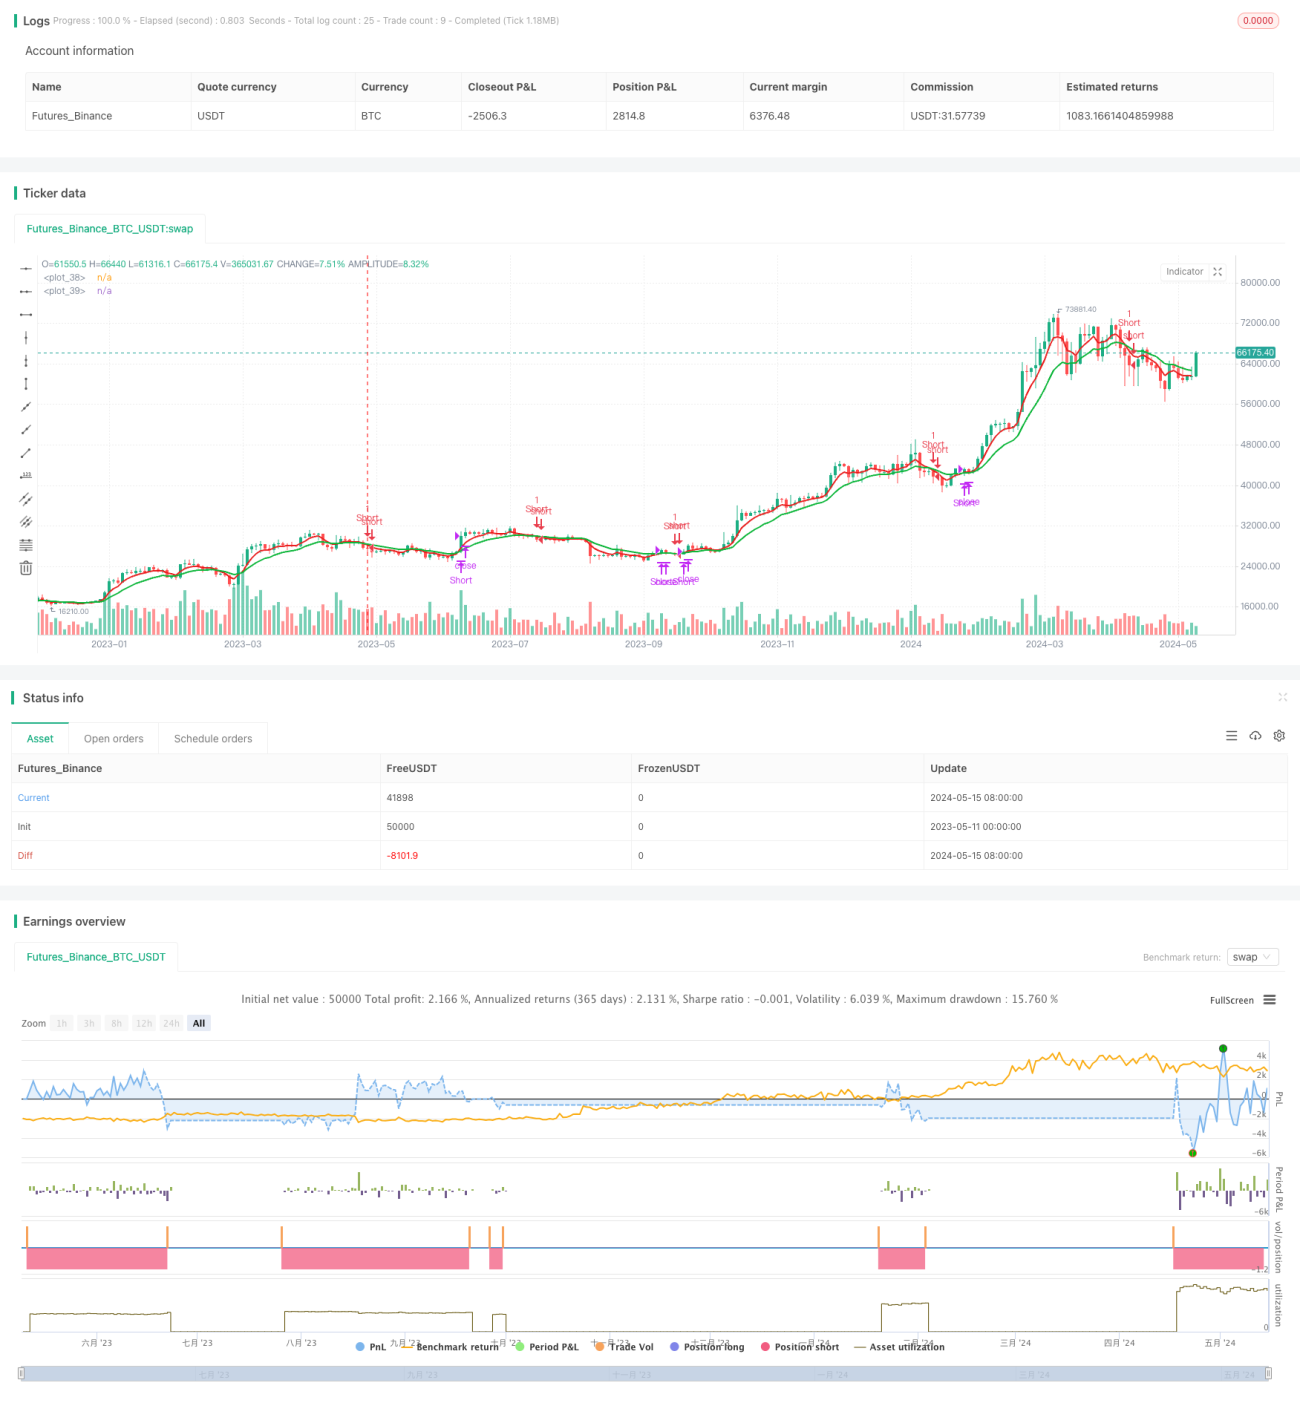
이 전략은 5일 지수 이동 평균 ((EMA5)) 과 13일 지수 이동 평균 ((EMA13) 의 교차를 사용하여 거래 신호를 생성한다. EMA5 상위에서 EMA13를 통과하면 다중 신호가 발생하며, EMA5 아래에서 EMA13를 통과하면 공백 신호가 발생한다. 이 전략은 단기 경향의 변화를 포착하고, 두 개의 이동 평균의 교차를 사용하여 입점과 출구를 결정한다.
전략 원칙
이 전략의 핵심은 두 개의 다른 기간의 지수 이동 평균 (EMA) 의 교차를 사용하여 거래 신호를 생성하는 것이다. EMA는 일반적으로 사용되는 기술 지표이며, 최근의 가격 데이터에 더 높은 무게를 부여하고, 따라서 간단한 이동 평균 (SMA) 에 비해 가격의 변화를 더 잘 반영한다. 단기 EMA (EMA5) 가 상위에서 장기 EMA (EMA13) 를 통과할 때, 가격 상승 동력이 강화될 수 있음을 나타내고, 다중 신호를 생성한다. 반대로, 단기 EMA가 아래로 EMA를 통과할 때, 가격 하락 동력이 강화될 수 있음을 나타내고, 공백 신호를 생성한다.
전략적 이점
- 간단하고 이해하기 쉬운: 이 전략은 두 개의 EMA 지표만 사용하며, 원칙은 간단하고 이해하기 쉽고 구현하기 쉽습니다.
- 적응력: EMA의 주기적 매개 변수를 조정하여 다양한 시장 환경과 거래 품종에 적응할 수 있다.
- 시간적: SMA에 비해 EMA는 가격 변화에 더 신속하게 반응하여 트렌드 변화를 빠르게 포착하는 데 도움이됩니다.
- 확장성: 이 전략의 기초에 따라, 다른 기술 지표 또는 기본 요소와 결합하여 전략의 성능을 더욱 최적화 할 수 있습니다.
전략적 위험
- 가짜 신호: 흔들리는 시장이나 추세가 불명확할 때, EMA 교차는 더 많은 가짜 신호를 생성할 수 있으며, 이로 인해 더 많은 거래와 손실이 발생할 수 있다.
- 지연성: SMA에 비해 EMA의 지연성이 작지만, 여전히 약간의 지연성이 존재하며, 최고의 출전 시간을 놓칠 수 있다.
- 중단 손실의 부재: 이 전략은 명확한 중단 손실 조건을 설정하지 않았으며, 시장 상황이 역전되면 큰 손실을 입을 수 있습니다.
- 매개 변수 최적화: EMA 주기 매개 변수의 선택은 다른 시장과 품종에 따라 최적화해야 하며, 그렇지 않으면 전략의 성능에 영향을 줄 수 있다.
전략 최적화 방향
- 트렌드 필터를 추가: EMA 교차 신호를 기반으로, 장기 트렌드 지표 (예: EMA50) 와 결합하여 트렌드 필터를 사용하여 가짜 신호를 줄인다.
- 설정 스톱: ATR과 같은 지표에 따라 동적 스톱을 설정하거나 단일 거래의 최대 손실을 제어하기 위해 고정 비율 스톱을 사용합니다.
- 최적화 매개 변수: 역사적인 데이터를 재검토하여 EMA 주기 매개 변수를 최적화하여 현재 시장과 품종에 가장 적합한 매개 변수 조합을 찾습니다.
- 다른 지표와 결합: 다른 기술 지표 (RSI, MACD 등) 와 결합하여 신호 확인과 신뢰성을 높이기 위해 사용한다.
요약하다
EMA5와 EMA13 교차 전략은 두 개의 다른 주기적 EMA의 교차를 통해 가격 추세의 변화를 포착하는 간단한 트렌드 추적 전략이다. 이 전략의 장점은 단순하고 적응력이 강하며 시기적절성이 높지만, 동시에 가짜 신호, 지연성 및 중단 부족 등의 위험이 있습니다. 전략의 성능을 더 이상 최적화하기 위해 추세 필터를 추가하고, 중지, 최적화 파라미터를 설정하고, 다른 기술 지표 방법과 결합하는 것을 고려 할 수 있습니다. 실제 응용에서는 특정 시장 환경과 거래 유형에 따라 조정 및 최적화가 필요합니다.
- 1