
“7과 1의 슈퍼 지표 전략”이라고 불리는 이 양적 거래 전략은 7개의 인기있는 기술 지표를 통합하여 사용한다. 상대적으로 약한 지표 ((RSI), 이동 평균 수렴 분산 지표 ((MACD), 무작위 지표 ((Stochastic), 브린 밴드 ((Bollinger Bands), 간단한 이동 평균 ((SMA), 지수 이동 평균 ((EMA) 및 거래량 ((Volume)). 이 지표의 신호를 통합하여 시장의 과매 및 과매 상태를 식별하여 최적의 매수 기회를 찾아내는 것을 목표로 한다. 전략은 또한 거래 수행 및 위험을 최적화하기 위해 손해 차단기와 시간 기반 필터를 설정한다.
이 전략의 핵심 원칙은 더 포괄적인 신뢰할 수 있는 거래 신호를 얻기 위해 여러 기술적 지표를 통합적으로 사용하는 것입니다. 각 지표는 고유한 계산 방법과 시장 움직임을 해석하는 관점을 가지고 있습니다. 예를 들어, RSI는 가격 변화의 속도와 강도를 측정합니다. MACD는 이동 평균의 교차로 인해 추세를 판단합니다.
전략은 기한을 설정하여 여러 지표의 신호 강도를 종합적으로 판단한다. 지표가 특정 조합 조건을 충족하면 매매 신호가 발생한다. 동시에 전략은 거래량과 같은 다른 시장 정보를 고려하여 가격 움직임을 확인한다. 또한 전략은 스톱 손실 및 거래 시간 필터링과 같은 위험 관리 및 최적화 조치를 포함하여 기회를 잡는 동시에 위험을 제어한다.
이 “7과 1 슈퍼 지표 전략”의 주요 장점은 포괄성과 유연성입니다. 여러 지표를 종합적으로 고려함으로써 전략은 시장 신호를 다양한 관점에서 검증하여 신뢰할 수있는 거래 기회를 창출 할 수 있습니다. 개별 지표가 잘못된 신호를 냈더라도 대부분의 지표가 일치하는 한 전략은 올바른 판단을 할 수 있습니다.
또한, 이 전략은 풍부한 파라미터 옵션을 제공하며, 사용자는 자신의 선호도와 거래 스타일에 따라 조정할 수 있습니다. 다양한 파라미터 조합은 다양한 시장 상황에 맞게 다른 신호 민감도와 주파수를 생성 할 수 있습니다. 전략은 또한 스톱 스톱 손실 및 거래 시간 필터와 같은 위험 관리 도구를 내장하여 실용성과 제어성을 더욱 향상시킵니다.
이 전략은 많은 장점이 있지만, 잠재적인 위험도 있습니다. 첫째, 전략의 성과는 선택된 매개 변수의 합리성에 크게 달려 있습니다. 부적절한 매개 변수 설정은 신호를 왜곡하여 잘못된 거래 결정을 초래할 수 있습니다. 둘째, 이 전략은 주로 역사적 데이터와 통계 법칙에 기반하고 있으며, 시장 상황은 급변하며, 과거의 법칙은 반드시 미래에 적용되지 않습니다.
또한, 극단적 인 상황에서는 여러 지표가 동시에 실패하여 전략이 잘못된 판단을 할 수 있습니다. 전략은 또한 불안한 시장에서 종종 모순된 신호를 생성하여 과도한 거래와 자금의 빠른 소모로 이어질 수 있습니다.
전략의 안정성과 수익 잠재력을 더욱 높이기 위해 다음과 같은 측면에서 최적화할 수 있습니다.
이러한 최적화를 통해 전략은 우위를 유지하면서 복잡한 시장 환경에 대응할 수 있는 능력을 더욱 향상시키고 사용자에게 더 안정적인 수익을 가져다 줄 수 있습니다.
전체적으로 7인1 슈퍼 지표 전략은 강력한 기능으로 설계된 종합적인 수량 거래 전략입니다. 그것은 7개의 일반적인 기술 지표를 교묘하게 결합하여 시장의 맥박을 여러 각도에서 파악하고 거래자에게 신뢰할 수있는 매매 신호를 제공합니다. 풍부한 파라미터 선택과 내장 된 위험 관리 도구는 전략을 유연하고 사용하기 쉽고 적응력을 제공합니다.
그러나, 전략의 성과는 여전히 매개 변수 선택, 시장 환경과 같은 요인에 의해 영향을 받으며, 거래자는 자신의 경험과 피드백 결과에 따라 그것을 조정해야합니다. 더 많은 지표 차원을 도입하고, 중지 손실 논리를 최적화하고, 거래 시간 필터링을 정교하게하는 등의 조치를 도입함으로써, 이 전략은 위험 저항력과 수익 잠재력을 더욱 향상시킬 것으로 예상되며, 양적 거래자의 도움이 될 것입니다.
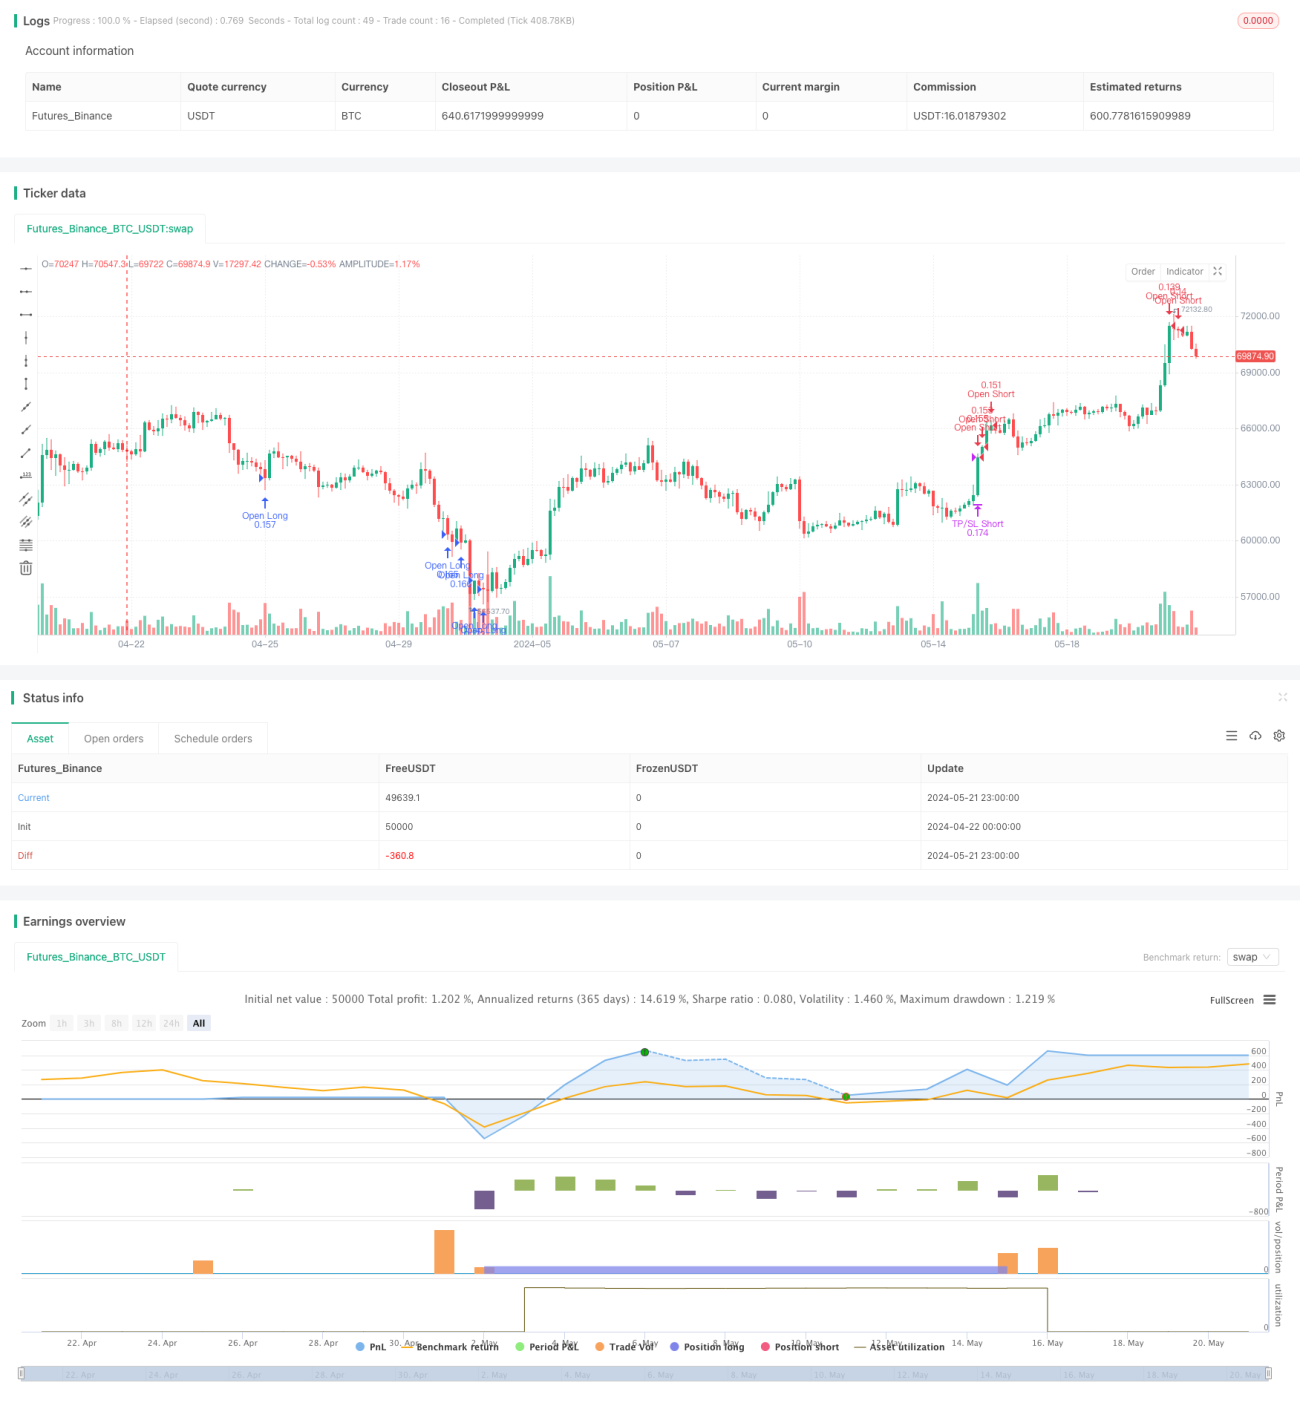
/*backtest
start: 2024-04-22 00:00:00
end: 2024-05-22 00:00:00
period: 3h
basePeriod: 15m
exchanges: [{"eid":"Futures_Binance","currency":"BTC_USDT"}]
*/
//@version=5
strategy(title='Super Indicator 7 in 1', shorttitle='Super Indicator 7 in 1', overlay=true, initial_capital=100, pyramiding=0, default_qty_value=10000, default_qty_type=strategy.cash)
// Defining indicator parameters
show_plots = input(false, title="Show Plots", group="Visibility")
show_indicators = input(false, title="Show Indicators", group="Visibility")
show_trades = input(true, title="Show Trades", group="Visibility")
show_labels = input(false, title="Show Labels", group="Visibility")
start_hour = input.int(0, title="Start Hour (24h format)", group="Time-Based Filter", minval=0, maxval=24)
end_hour = input.int(24, title="End Hour (24h format)", group="Time-Based Filter", minval=0, maxval=24)
stop_trading = input(false, "Stop Trading", group="Time-Based Filter")
trade_time = (hour >= start_hour and hour <= end_hour)
bgcolor(trade_time and (start_hour != 0 or end_hour != 24) ? color.new(color.blue, 90) : na)
volume_length = input.int(1, title="Volume SMA Length", group="Volume", minval=1, step=1)
sma_period = input.int(50, title="SMA Period", group="Moving Averages")
ema_period = input.int(50, title="EMA Period", group="Moving Averages")
bb_length = input.int(20, title='Bollinger Bands Length', group="Bollinger Bands")
mult = input.float(2.0, title='Bollinger Bands MultFactor', group="Bollinger Bands")
src = input(close, title='Bollinger Bands Source', group="Bollinger Bands")
rsi_length = input.int(14, title='RSI Length', group="RSI")
macd_fast_length = input.int(12, title='MACD Fast Length', group="MACD")
macd_slow_length = input.int(26, title='MACD Slow Length', group="MACD")
macd_signal_length = input.int(9, title='MACD Signal Smoothing', group="MACD")
stoch_length = input.int(14, title='Stochastic Length', group="Stochastic")
smoothK = input.int(3, title='Stochastic %K Smoothing', group="Stochastic")
smoothD = input.int(3, title='Stochastic %D Smoothing', group="Stochastic")
tp_percent = input.float(0.14, title="Take Profit (%)", group="Trade Settings", minval=0.01, step=0.01) / 100
sl_percent = input.float(0.25, title="Stop Loss (%)", group="Trade Settings", minval=0.01, step=0.01) / 100
// Calculating indicators
dev = mult * ta.stdev(src, bb_length)
upper = ta.sma(src, bb_length) + dev
lower = ta.sma(src, bb_length) - dev
rsi_value = ta.rsi(close, rsi_length)
stoch_value = ta.stoch(close, high, low, stoch_length)
[macd_line, signal_line, _] = ta.macd(close, macd_fast_length, macd_slow_length, macd_signal_length)
k = ta.sma(stoch_value, smoothK)
d = ta.sma(k, smoothD)
sma = ta.sma(close, sma_period)
ema = ta.ema(close, ema_period)
volume_ma = ta.sma(volume, volume_length)
volume_condition = volume >= volume_ma
// Signal definitions(-10%, Normal, +10% and ! failed indicator)
min_buy_signal = rsi_value < 33 and rsi_value > 30 and stoch_value < 22 and stoch_value > 20 and low < lower and macd_line < 0 and volume_condition
min_sell_signal = rsi_value > 63 and rsi_value < 70 and stoch_value > 72 and stoch_value < 80 and high > upper and macd_line > 0 and volume_condition
buy_signal = rsi_value < 30 and stoch_value < 20 and low < lower and macd_line < 0 and volume_condition
sell_signal = rsi_value > 70 and stoch_value > 80 and high > upper and macd_line > 0 and volume_condition
max_buy_signal = rsi_value < 27 and stoch_value < 18 and low < lower and macd_line < 0 and volume_condition
max_sell_signal = rsi_value > 77 and stoch_value > 80 and high > upper and macd_line > 0 and volume_condition
buy_condition = (rsi_value < 30 ? 1 : 0) + (stoch_value < 20 ? 1 : 0) + (macd_line < 0 ? 1 : 0) + (low < lower ? 1 : 0) + (volume_condition ? 1 : 0) == 4
sell_condition = (rsi_value > 70 ? 1 : 0) + (stoch_value > 80 ? 1 : 0) + (macd_line > 0 ? 1 : 0) + (high > upper ? 1 : 0) + (volume_condition ? 1 : 0) == 4
// Plotting buy and sell signals
plotshape(show_plots and min_buy_signal, style=shape.triangleup, location=location.belowbar, color=#00ffb7, size=size.small, title="Min Buy Signal")
plotshape(show_plots and min_sell_signal, style=shape.triangledown, location=location.abovebar, color=#efa803, size=size.small, title="Min Sell Signal")
plotshape(show_plots and buy_signal and not max_buy_signal, style=shape.triangleup, location=location.belowbar, color=#004cff, size=size.small, title="Buy Signal")
plotshape(show_plots and sell_signal and not max_sell_signal, style=shape.triangledown, location=location.abovebar, color=#ffff00, size=size.small, title="Sell Signal")
plotshape(show_plots and max_buy_signal, style=shape.triangleup, location=location.belowbar, color=#1eff00, size=size.small, title="Max Buy Signal")
plotshape(show_plots and max_sell_signal, style=shape.triangledown, location=location.abovebar, color=#ff0000, size=size.small, title="Max Sell Signal")
plotshape(show_plots and buy_condition and not min_buy_signal and not buy_signal and not max_buy_signal, style=shape.triangleup, location=location.belowbar, color=#ffffff, size=size.small, title="Buy Condition")
plotshape(show_plots and sell_condition and not min_sell_signal and not sell_signal and not max_sell_signal, style=shape.triangledown, location=location.abovebar, color=#ffffff, size=size.small, title="Sell Condition")
// Plotting moving averages
plot(show_indicators ? sma : na, color=#fc0000, linewidth=2, title="SMA")
plot(show_indicators ? ema : na, color=#00aaff, linewidth=2, title="EMA")
// Crossover labels for moving averages
BullCross = ta.crossover(ema, sma)
BearCross = ta.crossunder(ema, sma)
if (show_labels)
if (BullCross)
label.new(bar_index, sma, color=color.green, textcolor=color.white, style=label.style_cross, size=size.huge)
if (BearCross)
label.new(bar_index, sma, color=color.red, textcolor=color.white, style=label.style_cross, size=size.huge)
// Calculating take profit and stop loss
long_take_profit = close * (1 + tp_percent)
long_stop_loss = close * (1 - sl_percent)
short_take_profit = close * (1 - tp_percent)
short_stop_loss = close * (1 + sl_percent)
// Opening long and short orders based on signals
if (show_trades and trade_time and not stop_trading)
if (min_buy_signal or buy_signal or max_buy_signal or buy_condition)
strategy.entry("Open Long", strategy.long)
strategy.exit("TP/SL Long", limit=long_take_profit, stop=long_stop_loss)
if (min_sell_signal or sell_signal or max_sell_signal or sell_condition)
strategy.entry("Open Short", strategy.short)
strategy.exit("TP/SL Short", limit=short_take_profit, stop=short_stop_loss)