볼륨 히트맵과 실시간 가격을 기반으로 한 매수 및 매도 전략

EMA VWAP SMA
생성 날짜: 2024-05-24 17:16:58 마지막으로 수정됨: 2024-05-24 17:16:58
복사: 2 클릭수: 575
avatar of ChaoZhang ChaoZhang
1
집중하다
1621
수행원

볼륨 히트맵과 실시간 가격을 기반으로 한 매수 및 매도 전략

개요

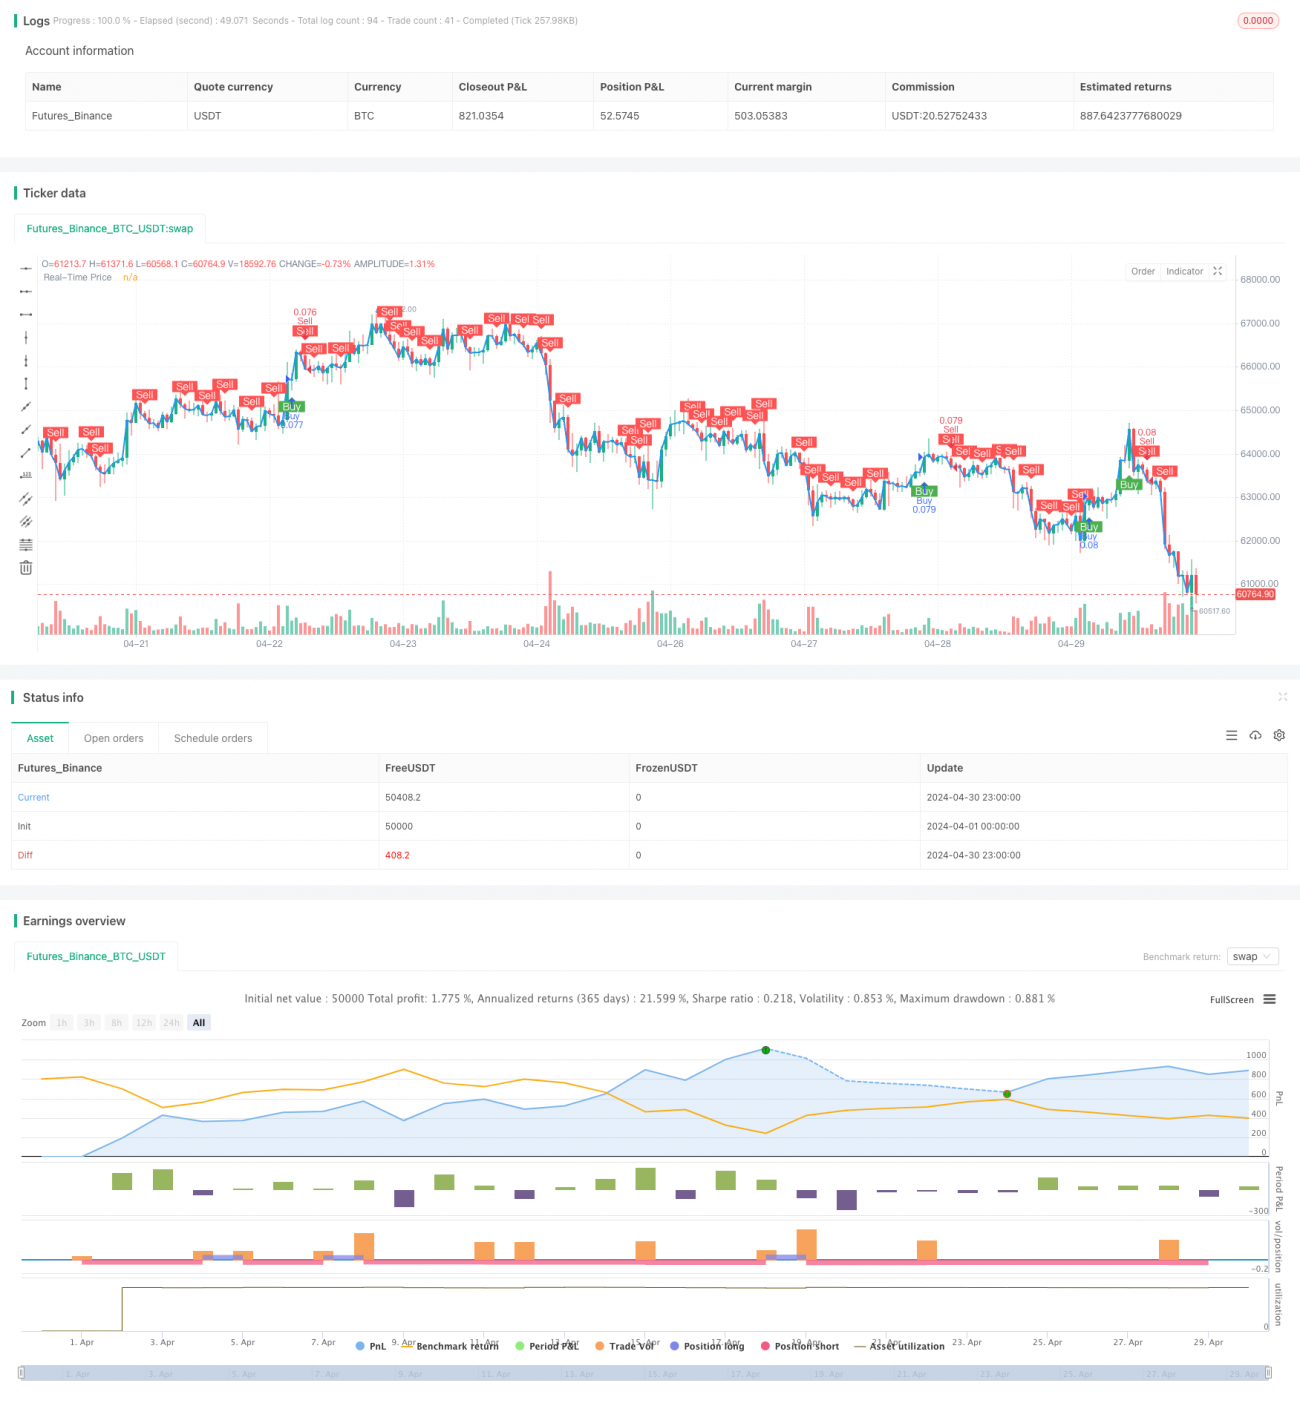
이 전략은 거래량 핫그래프와 실시간 가격을 결합하여 일정 시간 동안의 가격과 거래량 분포를 분석하여 매매 신호를 생성한다. 전략은 먼저 현재 가격과 설정된 가격 범위의 비율에 따라 몇 가지 가격 수준을 계산한다. 다음 각 가격 수준을 지난 시간 동안의 매매량을 통계적으로 계산하고 누적된 매매량을 계산한다. 누적된 매매량에 따라 라벨의 색상을 결정한다. 동시에 전략은 실시간 가격 곡선을 그리기도 한다.

전략 원칙

  1. 현재 가격과 설정된 가격 범위의 비율에 따라 몇 가지 가격 수준을 계산한다.
  2. 각 가격 레벨에 대해 지난 기간 동안의 매매량을 계산하고, 누적 매매량을 계산한다.
  3. 누적된 거래량에 따라 라벨의 색상을 결정하고, 라벨을 표시하거나 그래픽을 그리기
  4. 실시간 가격 곡선을 그리기.
  5. EMA, VWAP 등의 지표를 계산한다.
  6. 가격과 EMA, VWAP 등의 지표의 관계와 거래량 조건에 따라 구매 조건이 충족되는지 판단한다. 충족되고 이전에 신호가 발생하지 않은 경우 구매 신호가 발생한다.
  7. 가격과 EMA 등의 지표의 관계와 거래량 조건에 따라 판매 조건이 충족되는지 판단한다. 충족되고 이전에 신호가 발생하지 않은 경우 판매 신호가 발생한다. 연속적으로 두 개의 음선이 발생하고 이전에 신호가 발생하지 않은 경우 판매 신호가 발생한다.
  8. 현재 거래 조건의 상태를 기록하고, 신호 생성 상태를 업데이트한다.

우위 분석

  1. 거래량 핫그래프와 실시간 가격을 결합하여 가격과 거래량 분포를 직관적으로 보여줄 수 있으며 거래 의사 결정에 대한 참고 자료를 제공합니다.
  2. EMA, VWAP 등의 지표가 도입되어 전략의 조건 판단이 풍부해지고, 전략의 신뢰성이 높아졌다.
  3. 가격, 지표, 거래량과 같은 여러 요소를 고려하여 구매 및 판매 신호를 더욱 포괄적이고 안정적으로 만듭니다.
  4. 신호 생성 제한 조건을 설정하여 연속적으로 반복 신호를 생성하는 상황을 방지하고, 오해의 소지가 있는 신호를 줄인다.

위험 분석

  1. 전략의 성능은 가격 범위 비율, 회귀 기간 등의 파라미터 설정에 의해 영향을 받을 수 있으며, 상황에 따라 조정 및 최적화가 필요합니다.
  2. EMA, VWAP와 같은 지표는 그 자체로 지연과 한계가 있으며, 특정 시장 환경에서 유효하지 않을 수 있습니다.
  3. 이 전략은 주로 유동성이 강한 시장에 적용되며, 흔들리는 시장에서는 더 많은 가짜 신호를 생성할 수 있다.
  4. 전략의 위험 제어 조치는 비교적 간단하며, 스톱로스 및 포지션 관리와 같은 위험 관리 수단이 없다.

최적화 방향

  1. RSI, MACD, 브린 띠와 같은 기술 지표와 시장 감정 지표를 더 많이 도입하여 전략적 판단을 풍부하게합니다.
  2. 구매/판매 신호의 생성 조건을 최적화하여 신호의 정확성과 신뢰성을 향상시킵니다. 트렌드 방향을 확인하기 위해 여러 시간 프레임의 분석을 도입하는 것을 고려할 수 있습니다.
  3. 스톱로스 및 포지션 관리와 같은 리스크 제어 조치를 추가하고, 합리적인 스톱로스 및 포지션 크기를 설정하고, 단일 거래의 리스크 을 제어한다.
  4. 전략에 대한 변수 최적화 및 역검사, 최적의 변수 조합과 시장 적용 범위를 찾아내는 것.
  5. 이 전략과 다른 전략의 조합을 고려하여 다양한 전략의 장점을 활용하여 전체의 안정성과 수익성을 향상시킵니다.

요약하다

이 전략은 거래량 히트 그래프, 실시간 가격 및 여러 기술 지표를 결합하여 매매 신호를 생성하여 일정 기준 가치를 갖는다. 전략의 장점은 가격과 거래량 분포를 직관적으로 보여줄 수 있고, 여러 측면의 요소를 종합적으로 고려하여 신호를 생성하는 데 있다. 그러나 전략에는 파라미터 설정의 영향, 지표의 후진성, 추세 시장의 의존성 등과 같은 몇 가지 제한과 위험이 있습니다. 따라서 실제 응용에서 더 많은 지표, 최적화된 신호 조건, 위험 통제를 강화하는 등과 같은 전략의 안정성과 수익성을 향상시키기 위해 전략을 추가로 최적화하고 개선해야 한다.

전략 소스 코드
/*backtest
start: 2024-04-01 00:00:00
end: 2024-04-30 23:59:59
period: 1h
basePeriod: 15m
exchanges: [{"eid":"Futures_Binance","currency":"BTC_USDT"}]
*/

//@version=5
strategy("Buy and Sell Volume Heatmap with Real-Time Price Strategy", overlay=true, default_qty_type=strategy.percent_of_equity, default_qty_value=10)

// Settings for Volume Heatmap
lookbackPeriod = input.int(100, title="Lookback Period")
baseGreenColor = input.color(color.green, title="Buy Volume Color")
baseRedColor = input.color(color.red, title="Sell Volume Color")
priceLevels = input.int(10, title="Number of Price Levels")
priceRangePct = input.float(0.01, title="Price Range Percentage")
labelSize = input.string("small", title="Label Size", options=["tiny", "small", "normal", "large"])
showLabels = input.bool(true, title="Show Volume Labels")

// Initialize arrays to store price levels, buy volumes, and sell volumes
var float[] priceLevelsArr = array.new_float(priceLevels)
var float[] buyVolumes = array.new_float(priceLevels)
var float[] sellVolumes = array.new_float(priceLevels)

// Calculate price levels around the current price
for i = 0 to priceLevels - 1
    priceLevel = close * (1 + (i - priceLevels / 2) * priceRangePct)  // Adjust multiplier for desired spacing
    array.set(priceLevelsArr, i, priceLevel)

// Calculate buy and sell volumes for each price level
for i = 0 to priceLevels - 1
    level = array.get(priceLevelsArr, i)
    buyVol = 0.0
    sellVol = 0.0
    for j = 1 to lookbackPeriod
        if close[j] > open[j]
            if close[j] >= level and low[j] <= level
                buyVol := buyVol + volume[j]
        else
            if close[j] <= level and high[j] >= level
                sellVol := sellVol + volume[j]
    array.set(buyVolumes, i, buyVol)
    array.set(sellVolumes, i, sellVol)

// Determine the maximum volumes for normalization
maxBuyVolume = array.max(buyVolumes)
maxSellVolume = array.max(sellVolumes)

// Initialize cumulative buy and sell volumes for the current bar
cumulativeBuyVol = 0.0
cumulativeSellVol = 0.0

// Calculate colors based on the volumes and accumulate volumes for the current bar
for i = 0 to priceLevels - 1
    buyVol = array.get(buyVolumes, i)
    sellVol = array.get(sellVolumes, i)
    cumulativeBuyVol := cumulativeBuyVol + buyVol
    cumulativeSellVol := cumulativeSellVol + sellVol

// Determine the label color based on which volume is higher
labelColor = cumulativeBuyVol > cumulativeSellVol ? baseGreenColor : baseRedColor

// Initialize variables for plotshape
var float shapePosition = na
var color shapeColor = na

if cumulativeBuyVol > 0 or cumulativeSellVol > 0
    if showLabels
        labelText = "Buy: " + str.tostring(cumulativeBuyVol) + "\nSell: " + str.tostring(cumulativeSellVol)
        label.new(x=bar_index, y=high + (high - low) * 0.02, text=labelText, color=color.new(labelColor, 0), textcolor=color.white, style=label.style_label_down, size=labelSize)
    else
        shapePosition := high + (high - low) * 0.02
        shapeColor := labelColor

// Plot the shape outside the local scope
plotshape(series=showLabels ? na : shapePosition, location=location.absolute, style=shape.circle, size=size.tiny, color=shapeColor)

// Plot the real-time price on the chart
plot(close, title="Real-Time Price", color=color.blue, linewidth=2, style=plot.style_line)

// Mpullback Indicator Settings
a = ta.ema(close, 9)
b = ta.ema(close, 20)
e = ta.vwap(close)
volume_ma = ta.sma(volume, 20)

// Calculate conditions for buy and sell signals
buy_condition = close > a and close > e and volume > volume_ma and close > open and low > a and low > e // Ensure close, low are higher than open, EMA, and VWAP
sell_condition = close < a and close < b and close < e and volume > volume_ma

// Store the previous buy and sell conditions
var bool prev_buy_condition = na
var bool prev_sell_condition = na

// Track if a buy or sell signal has occurred
var bool signal_occurred = false

// Generate buy and sell signals based on conditions
buy_signal = buy_condition and not prev_buy_condition and not signal_occurred
sell_signal = sell_condition and not prev_sell_condition and not signal_occurred

// Determine bearish condition (close lower than the bottom 30% of the candle's range)
bearish = close < low + (high - low) * 0.3

// Add sell signal when there are two consecutive red candles and no signal has occurred
two_consecutive_red_candles = close[1] < open[1] and close < open
sell_signal := sell_signal or (two_consecutive_red_candles and not signal_occurred)

// Remember the current conditions for the next bar
prev_buy_condition := buy_condition
prev_sell_condition := sell_condition

// Update signal occurred status
signal_occurred := buy_signal or sell_signal

// Plot buy and sell signals
plotshape(buy_signal, title="Buy", style=shape.labelup, location=location.belowbar, color=color.green, text="Buy", textcolor=color.white)
plotshape(sell_signal, title="Sell", style=shape.labeldown, location=location.abovebar, color=color.red, text="Sell", textcolor=color.white)

// Strategy entry and exit
if buy_signal
    strategy.entry("Buy", strategy.long)

if sell_signal
    strategy.entry("Sell", strategy.short)