볼린저 밴드 다이나믹 테이크 프로핏 전략

1
Follow
1788
Followers
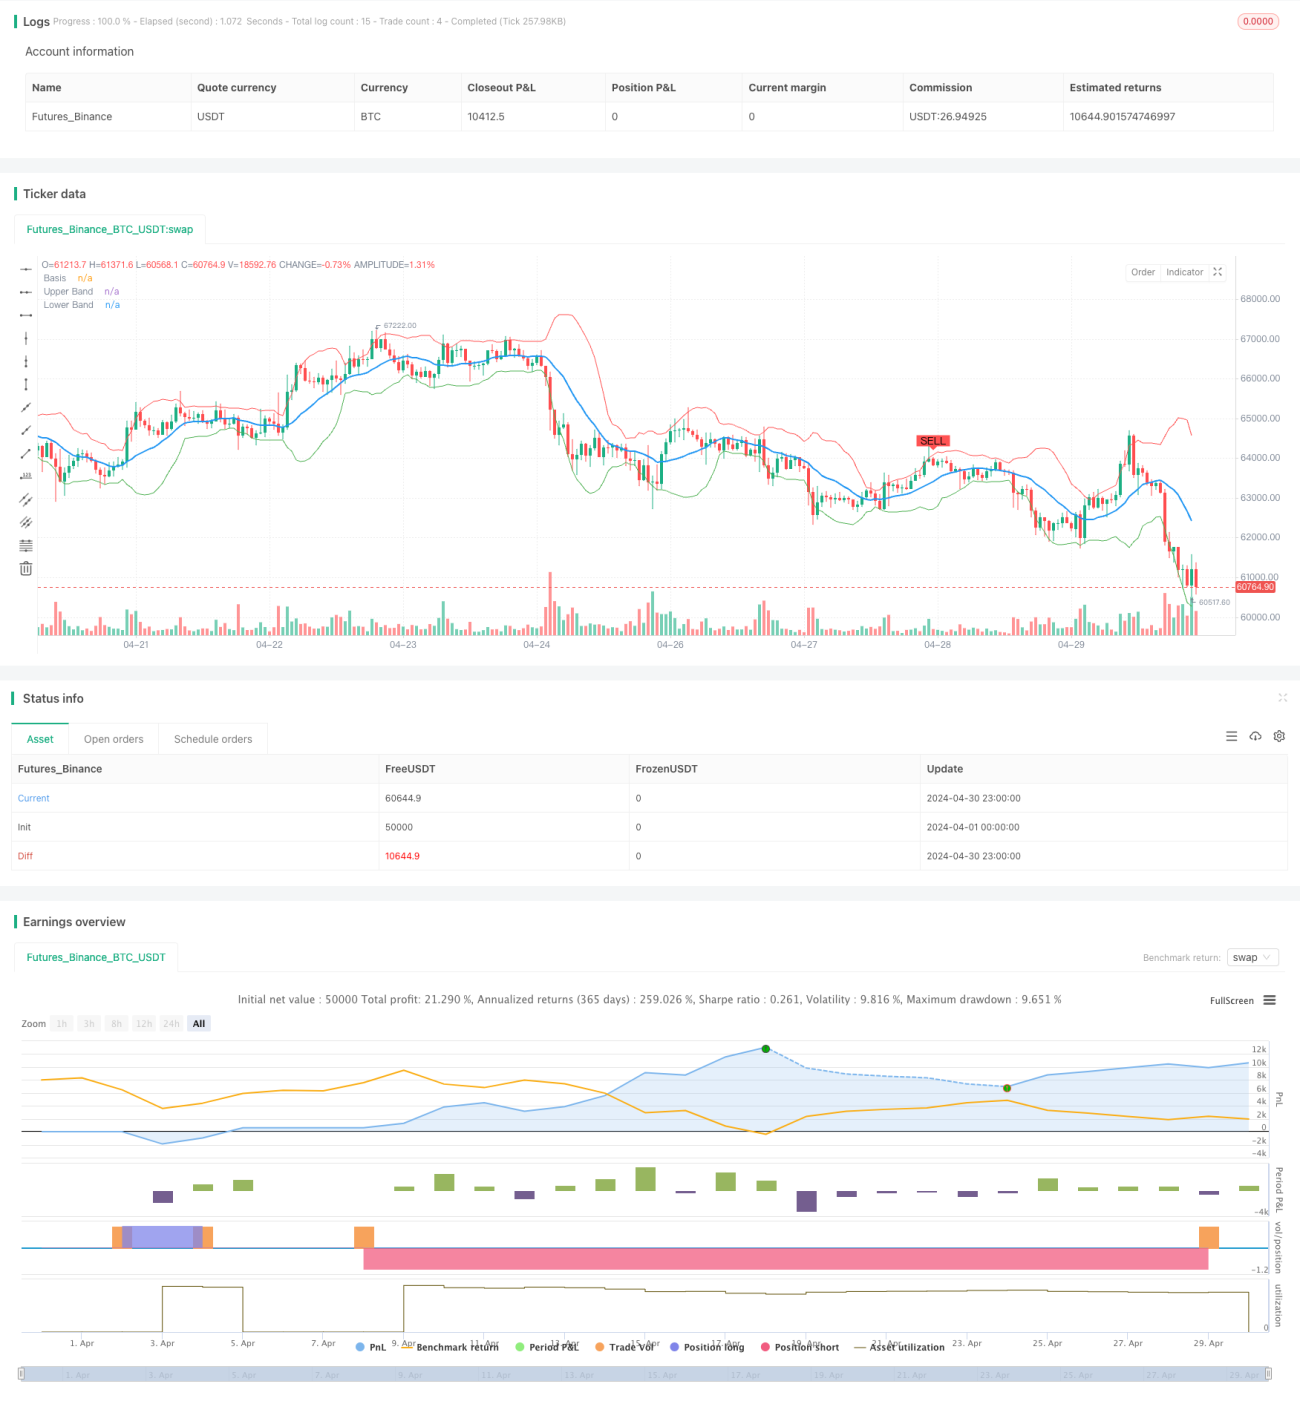
개요
이 전략은 볼링거 밴드 (Bollinger Bands) 지표를 사용하여, 가격이 상반도를 만질 때 공백하고, 하반도를 만질 때 더 많이하고, 동적 정지 지점을 설정하고, 지분 1%의 수익을 달성하면 평점이다. 이 전략의 핵심 아이디어는 가격이 항상 볼링거 밴드 내에서 변동하며, 평균 회귀의 특성을 가지고 있기 때문에 가격이 이동 평균선에서 너무 멀리 떨어져있을 때 역으로 작동하여 가격 차이의 이익을 얻을 수 있다.
전략 원칙
- 이동 평균과 표준 격차를 계산한다: 간단한 이동 평균 (SMA) 을 사용하여 종결 가격의 이동 평균 (basis) 을 계산하고, 종결 가격에 대한 이동 평균의 표준 격차 (dev) 를 계산한다.
- 위와 아래를 계산한다: 위 (upper) 는 base + dev 이다.*multiplier, 하단 레일 ((lower) 은 base - dev 입니다.*multiplier, 여기서 multiplier는 변동폭의 배수이다.
- 거래 신호를 생성한다: 종결 가격에서 경로를 통과하고 현재 종결 가격이 개시 가격보다 작으면 다중 신호를 생성한다. 종결 가격 아래에서 경로를 통과하고 현재 종결 가격이 개시 가격보다 크면 마이너스 신호를 생성한다.
- 동적 정지: 포지션을 개시한 후, 포지션 개시 가격과 정지 비율 (takeProfitPercentage) 에 따라 정지 가격을 계산하고, 가격이 정지 가격에 도달했을 때 정지한다.
- 시각화: 도표에 폴링거 띠, 이동 평균 및 거래 신호를 그리기.
전략적 이점
- 간단하고 효과적입니다. 이 전략은 명확한 논리를 가지고 있으며, 하나의 기술 지표를 사용하여 이해하기 쉽고 실행이 가능합니다.
- 범용성: 폴링거 띠는 범용성으로, 다양한 거래 기준과 시장에 사용할 수 있다.
- 다이내믹 스톱: 고정 스톱과 비교하여 다이내믹 스톱은 수익증의 수익을 극대화하면서 위험을 통제할 수 있다.
- 효율적으로 트렌드를 잡는 방법: 트렌드 상황에서 가격이 상행 또는 하행에 도달한 후, 일반적으로 원래 방향에서 한동안 계속 작동합니다. 이 전략은 이러한 트렌드 기회를 효과적으로 잡을 수 있습니다.
전략적 위험
- 불안정한 시장에서 좋지 않은 성과: 시장이 폭 폭이 흔들리고 가격이 폴링 띠 내에서 반복적으로 돌파 할 때, 이 전략은 거래 신호가 자주 나타날 수 있으며, 거래의 과도한 수와 수수료 비용이 증가 할 수 있습니다.
- 트렌드 상황에서의 회귀가 깊다: 트렌드가 장기간 지속되면 가격이 평균선에서 장기간 이탈하면, 이 전략의 역동성으로 인해 회귀가 깊을 수 있다.
- 매개 변수 선택의 어려움: 폴링거 대역의 매개 변수 (예: 길이, 배수) 는 전략의 성능에 큰 영향을 미치지만, 모든 곳에서 가장 적합한 매개 변수가 아닙니다.
전략 최적화 방향
- 트렌드 판단과 결합: 전략에 트렌드 판단 지표 (예를 들어, 이동 평균) 를 추가하여, 트렌드 상황에서 거래를 중지하거나, 순차적으로 거래를 할 수 있다.
- 스톱 스톱 손실을 최적화: ATR과 같은 변동률 지표에 따라 스톱 스톱 손실을 동적으로 조정하여 더 나은 수익 위험 비율을 얻을 수 있습니다.
- 다인자 조합: RSI, MACD 등과 다른 기술 지표와 함께 볼링거 띠를 사용하는 것을 고려하여 신호의 정확성을 높이고 가짜 신호를 줄이십시오.
- 기본적 필터: 거래 신호가 생성된 후 기본적 데이터 (예: 수익 보고서, 산업 데이터 등) 를 통해 2차 확인을 할 수 있으므로 전략의 안정성을 높일 수 있다.
요약하다
이 전략은 폴링거 띠를 이용한 간단한 효과적인 거래 시스템을 구축하여 가격의 상향과 하향을 신호로 삼고, 동적 정지 방식을 사용하여 위험을 제어한다. 전략은 추세 상황에서 잘 작동하지만, 불안정한 시장에서 자주 거래하는 문제가 발생할 수 있다. 추세를 판단하고, 정지 및 손실을 최적화하고, 요인 조합, 기본 필터 등을 통해 전략을 개선하여 더 안정적인 수익을 얻을 수 있다.
Source
Pine
Strategy parameters
Related strategies
Comment
All comments (0)
No data
- 1