SMC 및 EMA 전략 및 손익 예측

1
Follow
1782
Followers
개요
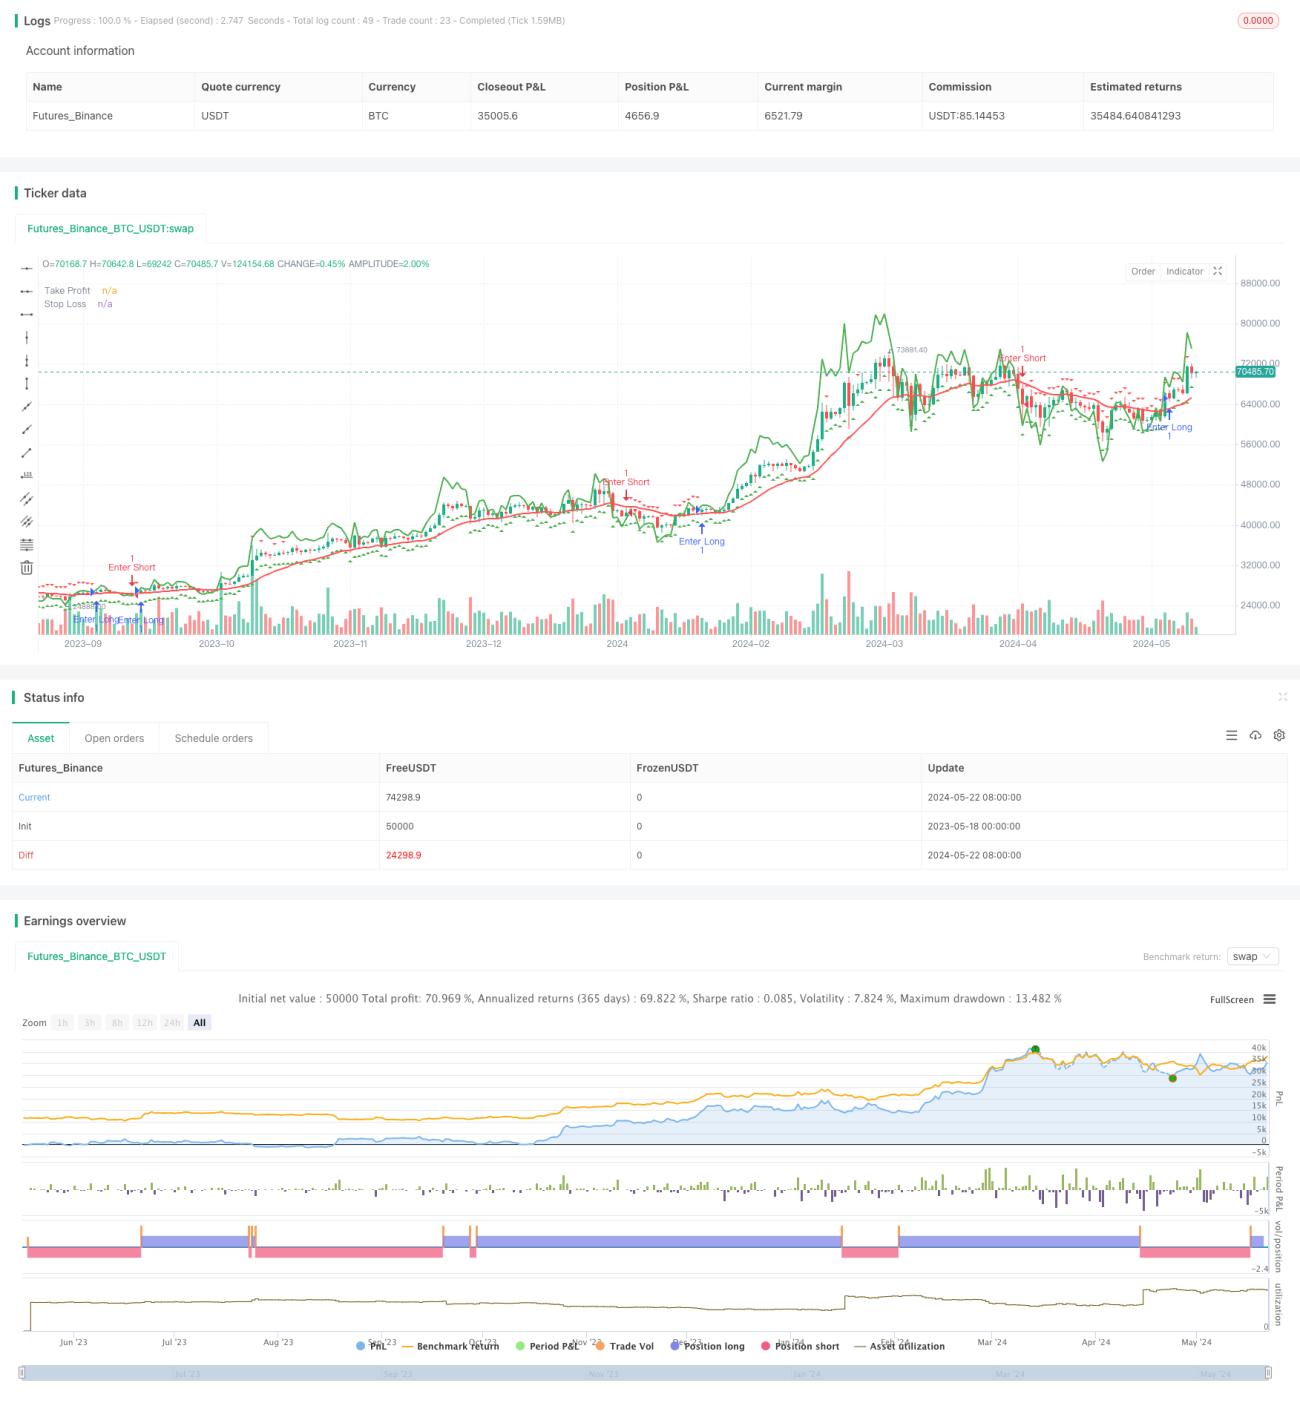
이 전략은 두 개의 다른 주기의 지수 이동 평균 ((EMA) 을 사용하여 현재 시장 추세를 판단하고, 빠른 선이 느린 선 위에 있을 때 낙관적 추세라고 간주하고, 반대로 낙관적 추세라고 간주한다. 동시에, 이 전략은 위험 수익률을 계산하고, 스톱 및 스톱 손실 수준을 계산하여 거래의 위험 관리를 최적화한다.
전략 원칙
이 전략의 핵심 원칙은 시장의 추세를 잡기 위해 다양한 주기의 EMA를 이용하는 것이다. 빠른 EMA (기기 10) 가 느린 EMA (기기 20) 에 윗쪽에 있을 때, 시장이 상승 추세에 있다고 생각하면, 이 전략은 구매 신호를 생성한다. 반대로, 빠른 EMA가 느린 EMA 아래에 있을 때, 시장이 하향 추세에 있다고 생각하면, 이 전략은 판매 신호를 생성한다.
추세를 판단하는 것 외에도 이 전략은 위험 관리의 개념을 도입한다. 위험-수익 비율을 계산하여 각 거래의 잠재적인 위험과 수익을 평가한다. 또한 전략은 잠재적인 손실을 제한하고 수익을 잠금하는 데 도움이되는 EMA의 위치에 따라 중지 및 중단 수준을 계산한다.
전략적 이점
- 간단하고 효과적입니다. 이 전략은 트렌드를 판단하기 위해 간단한 EMA 크로스를 사용하며 이해하기 쉽고 실행이 가능합니다.
- 위험 관리: 이 전략은 위험의 수익률을 계산하고, 스톱 스톱을 설정함으로써, 위험 관리를 최적화하는데 도움을 준다.
- 적응력: 이 전략은 EMA의 주기적 및 리스크 수익률의 하락값을 조정하여 다양한 시장 환경에 적응할 수 있다.
전략적 위험
- 가짜 신호: 흔들리는 시장이나 트렌드 전환점에서 EMA 교차는 가짜 신호를 생성하여 잘못된 거래 결정을 초래할 수 있습니다.
- 지연성: 트렌드 추적 전략으로서, EMA 교차는 트렌드가 확립된 후에 신호를 발생시킬 수 있으며, 초기 거래 기회를 놓치게 된다.
- 고정된 스톱: 이 전략은 고정된 스톱 레벨을 사용하며, 변동이 많은 시장에서 전략의 성과에 영향을 미치는 자주 스톱을 초래할 수 있다.
전략 최적화 방향
- 다른 지표를 도입: RSI, MACD 등과 같은 다른 기술 지표와 결합하여 신호의 신뢰성과 정확성을 향상시킵니다.
- 동적 스톱: 시장의 변동률이나 ATR과 같은 지표에 따라 스톱 레벨을 동적으로 조정하여 시장 변화에 더 잘 적응합니다.
- 최적화 매개 변수: 역검사 및 최적화를 통해 최적의 EMA 주기 및 리스크 수익률 절벽을 찾아 전략의 성능을 향상시킨다.
요약하다
이 전략은 EMA를 통해 트렌드를 판단하고 위험 관리 개념을 도입하여 거래자에게 간단하고 효과적인 거래 프레임 워크를 제공합니다. 이 전략은 잘못된 신호와 지연의 위험에 직면 할 수 있지만, 다른 지표, 동적 중단 및 변수 최적화와 같은 방법을 도입함으로써 전략의 성과와 안정성을 더욱 향상시킬 수 있습니다.
Source
Pine
Related strategies
Comment
All comments (0)
No data
- 1