
1
Follow
1781
Followers
개요
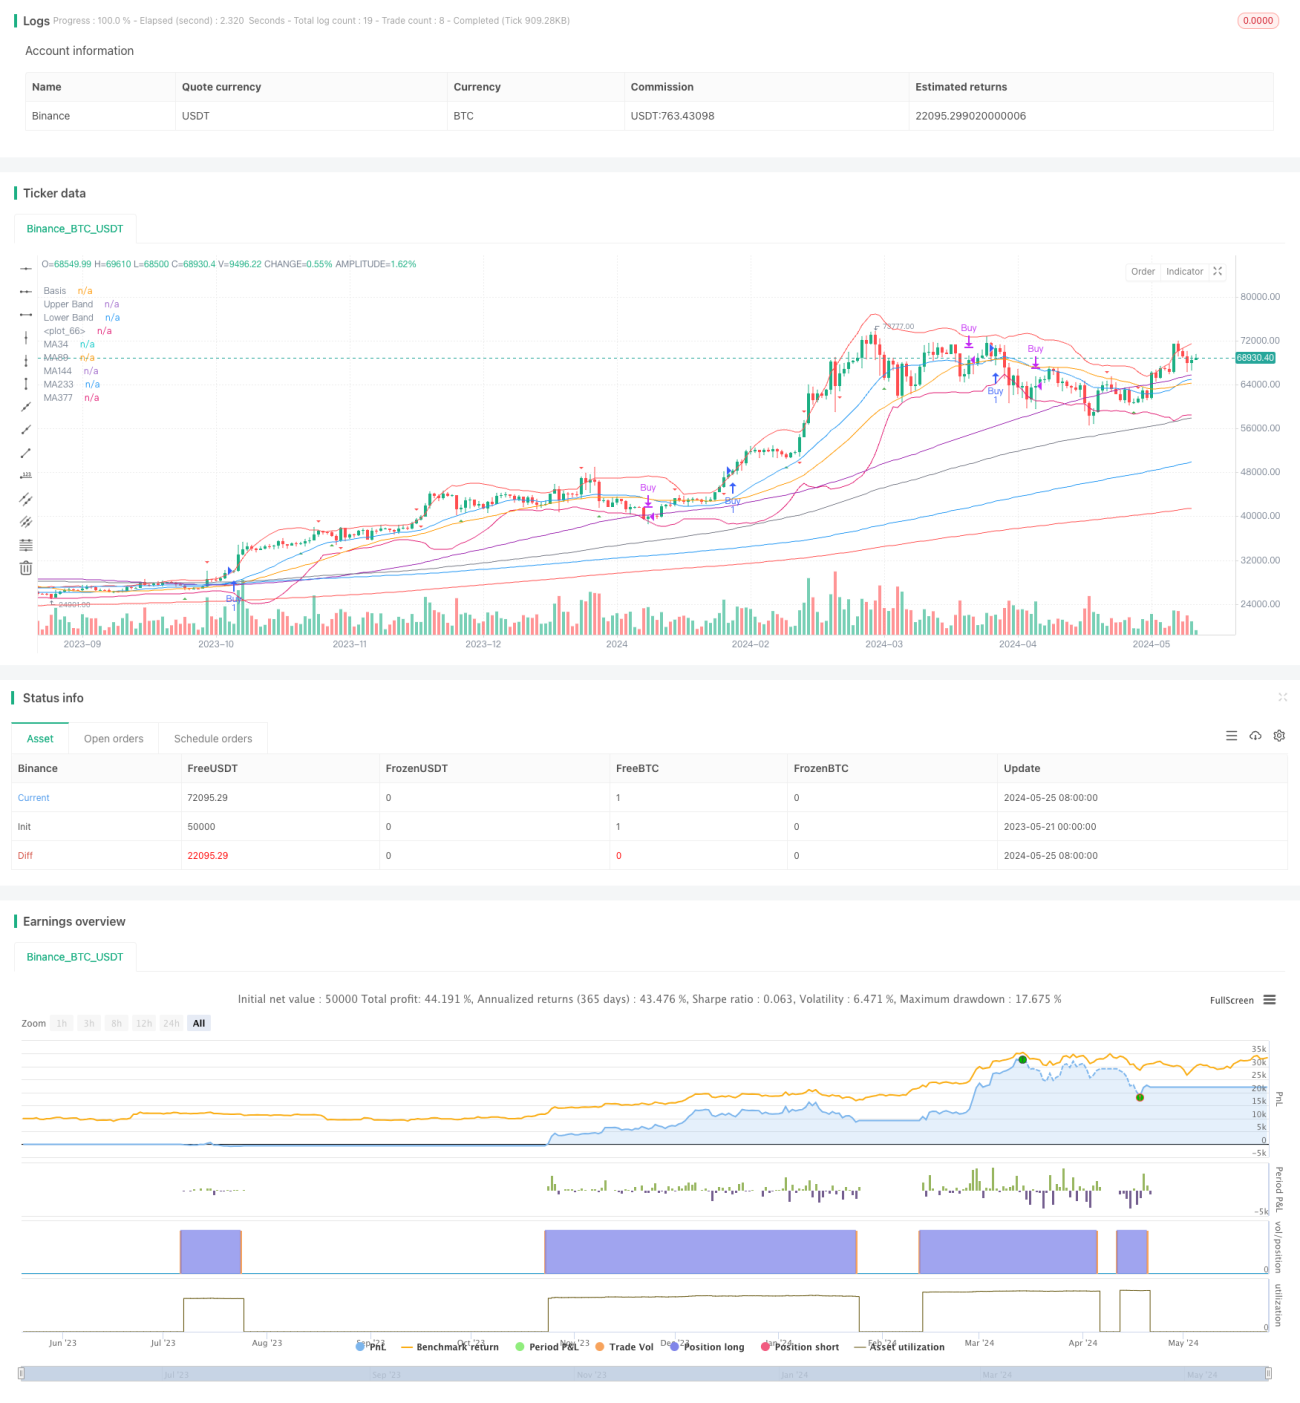
이 전략은 브린 밴드, RSI, 여러 이동 평균 및 MACD 지표를 결합하여 완전한 거래 시스템을 구축합니다. 우선 브린을 통해 가격의 변동 상황을 판단하고, 가격에 대한 브린 밴드 중간 궤도에 대한 위치를 사용하여 추세를 결정합니다. 동시에 RSI 지표를 사용하여 과매를 판단하고, RSI 회전을 사용하여 잠재적인 추세 반전을 식별합니다. 여러 이동 평균은 추세를 추적하고 저항 지점을 판단하는 데 사용됩니다. 마지막으로 MACD 지표는 추세와 잠재적인 반전을 판단하는 데 도움이됩니다.
전략 원칙
- 20주기, 2배 표준이 나쁜 브린띠를 사용하여, 종전 가격의 브린띠 중간 궤도에 대한 위치로 트렌드를 판단한다.
- 14주기 RSI를 계산하고 RSI가 30과 70의 레벨과 교차하여 과매매와 과매매를 판단하여 잠재적인 반전을 식별합니다.
- 34, 89, 144, 233, 377 및 610 주기의 간단한 이동 평균을 계산하고, 평균선의 다중 머리 배열을 통해 트렌드를 확인합니다. 평균선은 또한 지지 저항 지점으로 사용할 수 있습니다.
- 12,26,9 변수를 기반으로 MACD 지표를 계산하고 MACD 기둥 그래프와 0 축의 교차를 통해 추세 반전을 판단하는 데 도움을 줍니다.
- 이 지표들을 종합해서 평형 포지션의 논리를 정한다:
- 포지션 개설: 종결 가격이 부린 반도 중도 궤도 위에 있고, 단기 평균선이 장기 평균선 위에 있을 때 과대 포지션을 개설한다.
- 평정지: 종결가격이 부린띠 중간 궤도를 넘어갈 때 반 지점을 평정하고, 단기 평균선이 장기 평균선을 넘어갈 때 전체 지점을 평정한다.
전략적 이점
- 브린 띠는 물가 변동 상황을 객관적으로 정량화하여 추세 판단을 위한 근거를 제공한다.
- RSI를 도입하면 과매매를 판단하고 잠재적인 트렌드 전환 기회를 잡을 수 있습니다.
- 여러 평행선의 조합은 다양한 시간대에서 추세를 보다 포괄적으로 분석할 수 있다.
- MACD 지표는 트렌드 및 반전의 보조 판단으로 신호의 신뢰성을 향상시킵니다.
- 포지션 관리에 대한 아이디어가 포지션 관리 논리에 추가되어, 추세가 불확실할 때 위험을 제어하기 위해 포지션을 점진적으로 줄입니다.
전략적 위험
- 진동상태에서, 브린띠와 일률선 시스템은 빈번하고 모순된 신호를 생성할 수 있다.
- RSI와 MACD 지표는 강한 추세 상황에서는 장기간 오버 구매 오버 판매 영역에 머물러 판단력을 잃게 될 수 있습니다.
- 매개 변수 선택 (如布林带周期,均线周期等) 은 어느 정도 주관성이 있으며, 다른 매개 변수는 다른 결과를 가져올 수 있다.
- 단편 거래의 위험성을 증가시킬 수 있는 제약 장치의 부재.
- 이 사건으로 인해, 흑사병과 같은 극단적인 상황에서는 적절한 대응이 이루어지지 않을 수 있으며, 이로 인해 더 큰 회피가 발생할 수 있습니다.
전략 최적화 방향
- 각 지표의 파라미터를 보다 체계적으로 최적화하기 위해, 예를 들어, 브린 밴드의 주기 및 폭, RSI의 주기 및 경도 등.
- 교통량 변화와 같은 더 많은 확인 신호를 도입하여 신호의 신뢰도를 높여줍니다.
- 입장을 열 때 단편 거래의 위험을 더 잘 제어하기 위해 중지 및 중지 장치를 도입하십시오.
- 포지션 조정 메커니즘을 도입하는 것을 고려하여 다른 시장 상황에 따라 포지션을 유연하게 조정하여 수익 위험 비율을 높여라.
- 극단적인 상황의 설계에 대응하는 예측, 예를 들어 VIX 지수 기반의 보호 또는 알파 인자에 대한 역동적인 중화.
요약하다
이 전략은 트렌드 판단, 오버 바이 오버 셀 판단, 다중 시간 규모 분석, 포지션 제어 등과 같은 여러 차원에서보다 완벽한 거래 시스템을 구축했습니다. 그러나 전략은 충격적 인 상황, 극단적 인 상황에 대응할 때 최적화 될 필요가 있으며, 더 체계적인 변수 최적화 및 위험 제어가 부족합니다.
Source
Pine
Strategy parameters
Related strategies
Comment
All comments (0)
No data
- 1