하이브리드 2개 상태 Z-점수 정량화 전략

1
Follow
1781
Followers
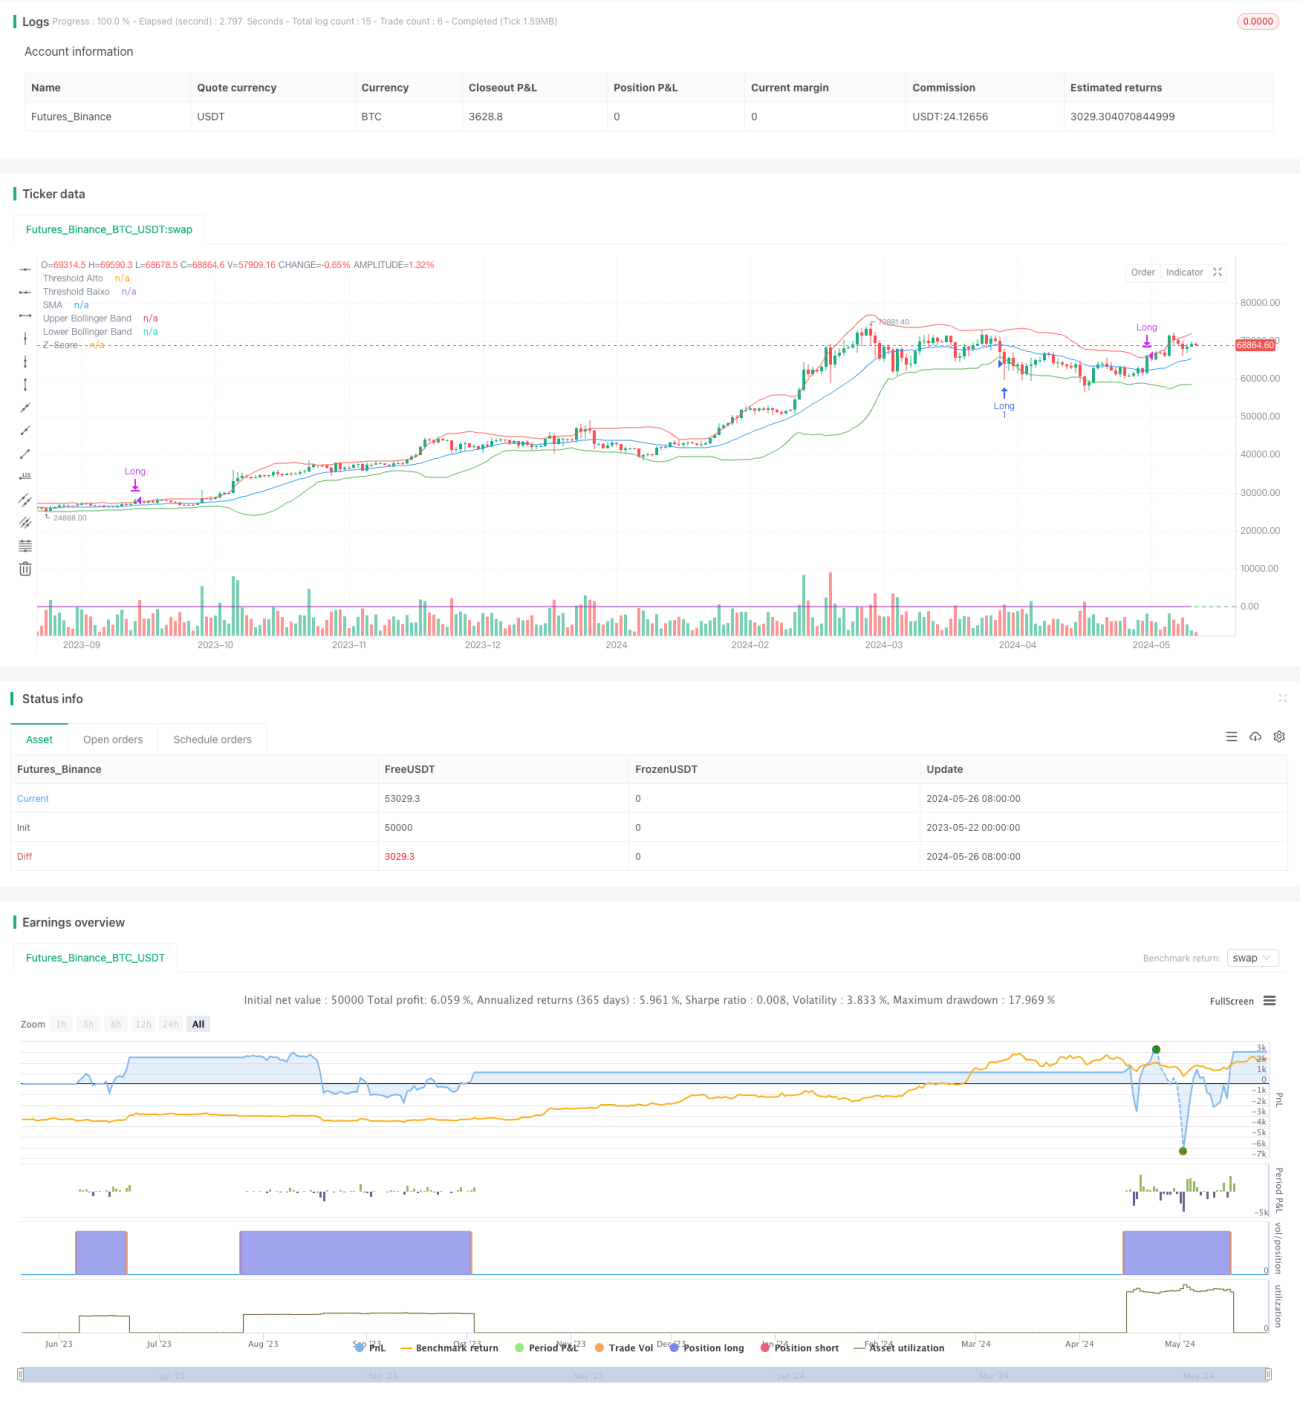
개요
이 전략은 혼합된 양적 분석 방법을 사용하여 두 가지 분산 모델과 회귀 분석을 결합하여 다른 시장 상태를 식별합니다. 전략은 먼저 간단한 이동 평균 (SMA) 및 브린 밴드 (BB) 지표를 계산하고, 그 다음 역사적인 수익에 대한 평균과 표준 차이를 기반으로 Z 스코어를 계산합니다. Z 스코어가 하위 하락값보다 낮고 가격이 하락값보다 낮으면 전략은 더 많은 위치를 열고, Z 스코어가 상위 하락값보다 높고 가격이 상위 하락값보다 높으면 전략은 평소합니다.
전략 원칙
이 전략의 핵심 원칙은 Z 점수를 사용하여 현재 수익을 역사적 수익 분포의 위치와 관련하여 측정하는 것입니다. Z 점수의 계산 공식은 다음과 같습니다. Z 점수가 높을수록 현재 수익이 극단적 인 경우 초과할 가능성이 높습니다. Z 점수가 낮을수록 현재 수익이 극단적 인 경우 초과할 가능성이 높습니다.
전략적 이점
- 양적 분석: 이 전략은 전적으로 양적 지표에 기반하고, 규칙이 명확하고, 실행과 재측정하기 쉽다.
- 이중 확인: 이 전략은 Z 점수와 브린 대역의 두 지표를 동시에 사용해서 이중 필터링 메커니즘을 형성하여 신호의 정확성을 향상시킨다.
- 통계학 기초: Z 점수는 통계학에서 정형 분포 이론에서 유래하여, 견고한 이론적 기초를 가지고 있으며, 현재 수익의 극단적인 정도를 객관적으로 측정할 수 있다.
- 매개 변수 유연성: 사용자는 필요에 따라 SMA 주기, 브린 띠 배수, Z 등급 저점 등의 매개 변수를 조정할 수 있으며, 다른 시장에 유연하게 적응할 수 있다.
전략적 위험
- 매개 변수 민감성: 다른 매개 변수 설정으로 인해 전략 성능에 큰 차이가 발생할 수 있으며, 충분한 매개 변수 최적화 및 안정성 테스트가 필요합니다.
- 추세 위험: 시장이 강한 추세에 빠지면, Z 등급은 장기적으로 극한 영역에있을 수 있으며, 전략 신호가 희박하거나 완전히 사라질 수 있습니다.
- 과도한 적합성 위험: 정책 매개 변수에 대해 과도하게 최적화하면 과다 적합성이 발생할 수 있으며, 표본에서 좋지 않은 성능을 나타낼 수 있습니다.
- 검은 천둥 위험: 극단적인 상황에서는, 역사적인 통계 법칙이 실패할 수 있고, 전략은 더 큰 철회 위험에 직면할 수 있다.
전략 최적화 방향
- 동적 파라미터: 시장의 변동률, 트렌드 강도 등의 지표에 따라 동적으로 Z 등급 하위값과 브린 대역 곱수를 조정하여 적응력을 높인다.
- 트렌드 필터를 추가: 기존 메커니즘에 MA 교차, DMI 등과 같은 트렌드 판단 지표를 중첩하여 강한 추세에서 너무 많은 무효 신호가 발생하지 않도록하십시오.
- 조합 최적화: 이 전략을 다른 양적 전략 (동량, 평균 회귀 등) 과 조합하여 각자의 장점을 발휘하고 안정성을 향상시킵니다.
- 손해 차단: 합리적인 손해 차단 장치를 도입하여 단일 거래 위험 허브를 제어하고 위험 조정 후 수익을 향상시킵니다.
요약하다
혼성 쌍방향 Z 점수 계량화 전략은 통계학적인 원리에 기반한 계량화 거래 전략으로, 현재 수익과 역사적 수익 분포를 비교하여 잠재적인 오버 바이 오버 셀 기회를 식별한다. 동시에, 전략은 브린 띠 지표를 사용하여 두 번 확인하여 신호 신뢰성을 향상시킨다. 전략 규칙은 명확하고, 구현 및 최적화하기 쉽지만, 또한 파라미터 민감성, 트렌드 위험, 과잉 적합성 위험과 같은 과제에 직면한다.
Source
Pine
Strategy parameters
Related strategies
Comment
All comments (0)
No data
- 1