변동성과 회귀선을 기반으로 한 롱숏 시장 메커니즘 최적화 전략

1
Follow
1781
Followers
개요
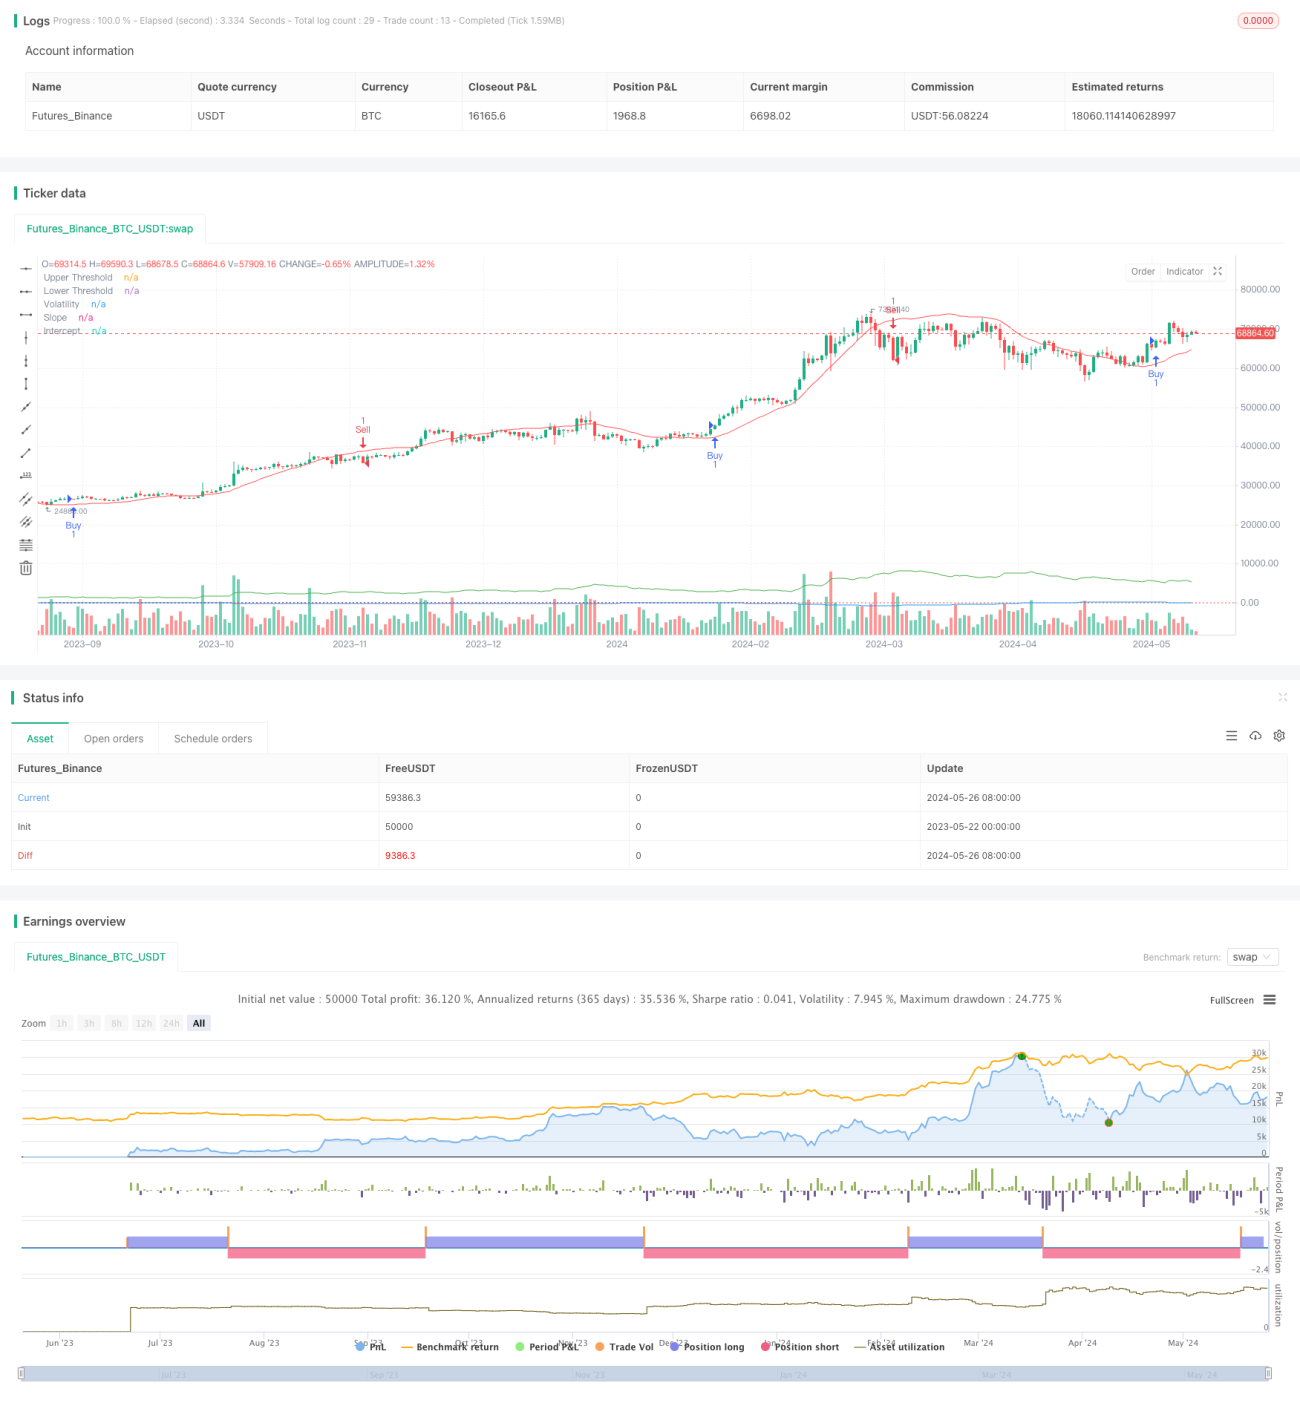
이 전략은 선형 회귀와 변동률 지표를 사용하여 시장의 다양한 상태를 식별하고, 구매 또는 판매 조건이 충족되면 대응하는 다단계 또는 공석 포지션을 설정합니다. 동시에, 이 전략은 시장 상황에 따라 변수를 최적화하고 조정하여 다양한 시장 환경에 맞게 조정할 수 있습니다. 전략은 지수 이동 평균을 거래 신호를 확인하는 부가적인 지표로도 사용합니다.
전략 원칙
- 선형 회귀의 절단점과 기울기를 계산하여 시장의 흐름을 결정한다.
- 평균 실제 변동률 ((ATR) 을 곱하여 변동률 지표로 계산한다.
- 경사율이 상승보다 높고 가격이 회귀선과 변동률보다 높을 때 구매 신호가 발생한다.
- 기울기가 하위 하위 값보다 작고 가격이 회귀선 미세 변동률보다 낮을 때 판매 신호를 생성한다.
- 빠른 및 느린 지수 이동 평균 ((EMA) 을 추가 확인 지표로 사용한다.
- 구매 신호가 나타나고 빠른 EMA가 느린 EMA보다 높을 때, 다단위 포지션을 설정한다.
- 팔기 신호가 나타나고 빠른 EMA가 느린 EMA보다 낮을 때 공백 포지션을 설정하십시오.
전략적 이점
- 선형 회귀와 변동률 지표를 결합하여 시장 상태와 추세를 더 정확하게 식별 할 수 있습니다.
- 부가적인 EMA 지표를 사용하여 거래 신호를 확인하여 전략의 신뢰성을 향상시킵니다.
- 다른 시장 환경과 품종 특성에 맞게 핵심 매개 변수를 최적화 할 수 있습니다.
- 트렌드와 변동성을 고려하여, 트렌드가 명확할 때 적시에 포지션을 설정하고, 변동성이 심해질 때 위험을 제어할 수 있다.
전략적 위험
- 잘못된 매개 변수 선택으로 인해 전략이 좋지 않을 수 있으며, 특정 품종과 시장 특성에 따라 최적화가 필요합니다.
- 위기 시장이나 트렌드 전환점에서는 전략이 빈번하게 거래되거나 잘못된 신호가 발생할 수 있습니다.
- 전략은 역사적 데이터에 의존하고, 갑작스러운 사건이나 시장의 비정상적인 변동에 대한 반응이 늦어질 수 있다.
전략 최적화 방향
- 다른 기술 지표나 기본 요소를 도입하여 전략적 의사 결정 기반을 풍부하게 하고, 신호의 정확성을 향상시킨다.
- 복귀 길, 변동률 곱, EMA 주기 등과 같은 최적화 파라미터를 선택하여 다른 품종과 시장 특성에 맞게 조정한다.
- 단편 거래 위험과 전체 철수 수준을 통제하기 위한 스톱로스 및 스톱스톱 메커니즘을 늘리십시오.
- 포지션 관리 및 자금 관리 규칙에 포지션 크기를 시장의 변동과 계좌의 자금에 따라 조정하는 것을 고려하십시오.
요약하다
이 전략은 선형적 회귀와 변동률 지표를 통해 시장 상태를 식별하고, EMA를 확인 지표로 사용하여, 적응력이 강한, 논리적으로 명확한 거래 전략을 구축한다. 전략의 장점은 추세와 변동성을 결합하고, 변수 최적화를 허용하며, 다양한 시장 환경에 적합하다. 그러나 전략에는 변수 선택, 격동 시장 및 블랙 <unk> 사건과 같은 위험이 존재하며, 실제 응용에서 지속적인 최적화와 개선이 필요합니다. 풍부한 신호 소스, 최적화 변수 선택, 위험 제어 조치 개선 등과 같은 측면에서 전략 개선이 가능하여 안정성과 수익성을 향상시킬 수 있다.
Source
Pine
Strategy parameters
Related strategies
Comment
All comments (0)
No data
- 1