개요
이 전략은 지수 이동 평균 ((EMA) 와 평균 진동 지표 ((AO) 를 기반으로 시장 추세 방향을 판단하고, K선 형태를 사용하여 구매 신호를 확인한다. EMA가 시장이 상승 추세에 있다는 것을 지시하고, AO 지표가 긍정적이며, 투기꾼이 삼켜버리는 형태가 나타나면, 전략은 구매 신호를 발생시킨다. 이 전략은 더 많이 하고, 공백을 하지 않는다. 동시에, 전략은 위험을 제어하기 위해 손해 중지 지점을 설정한다.
전략 원칙
이 전략의 핵심 원칙은 EMA와 AO 지표를 사용하여 시장 추세 방향을 판단하고 K 선 형태를 사용하여 구매 신호를 확인하는 것입니다. 구체적으로:
- 지정된 주기의 EMA를 계산하고, 시장 가격이 EMA보다 높을 때, 시장이 상승 추세에 있다고 본다.
- AO 지수를 계산해, AO 지수가 양성일 때, 시장의 추세가 올라간다고 본다.
- 현재 K 라인 종료 가격이 개시 가격보다 높고, 이전 K 라인 종료 가격이 개시 가격보다 낮고, 현재 K 라인 개시 가격이 이전 K 라인 종료 가격보다 낮고, 현재 K 라인 종료 가격이 이전 K 라인 최고 가격보다 높다는 점.
- 위의 세 가지 조건이 동시에 충족되면 구매 신호가 발생한다.
- 스톱로스를 설정하고, 시장 가격이 스톱로스보다 낮을 때 평점 스톱로스를 설정한다.
전략적 이점
- 동시 EMA와 AO를 사용하여 트렌드를 판단하면 잘못된 신호를 효과적으로 필터링하여 전략의 정확성을 향상시킬 수 있습니다.
- K선 형태를 사용하여 구매 신호를 확인하여 트렌드 확인과 동시에 더 나은 입시 시기를 잡을 수 있습니다.
- 스톱로스를 설정하여 전략적 위험을 효과적으로 통제하고 큰 회수를 피합니다.
- 전략의 논리는 명확하고, 이해하기 쉽고, 실행하기 쉽다.
전략적 위험
- 이 전략은 트렌딩 시장에서만 적용되며, 흔들리는 시장에서는 더 많은 가짜 신호가 나타날 수 있습니다.
- 정책의 매개 변수 선택은 정책의 성능에 큰 영향을 미치며, 다른 매개 변수는 다른 결과를 초래할 수 있다.
- 스톱로스의 설정은 전략의 조기 청산으로 이어지는 상승세를 놓치게 할 수 있다.
- 이 전략은 더 많이 하고, 공백을 두지 않고, 하락하는 상황에서 더 큰 기회비용이 발생할 수 있다.
전략 최적화 방향
- RSI, MACD 등과 같은 더 많은 기술적 지표가 추가되어 추세와 신호를 추가로 확인하는 것을 고려할 수 있습니다.
- 이동식 스톱, 스톱 추적 등으로 손실을 막는 전략을 최적화하여 위험을 더 잘 통제할 수 있습니다.
- 포지션 관리 전략에 추가하여 시장의 강하고 약한 추세와 신호 품질에 따라 포지션 크기를 조정할 수 있습니다.
- 다른 시장 상황에 적응하기 위해 코스피를 고려할 수 있습니다.
요약하다
이 전략은 EMA, AO 및 K 라인 형태를 통해 트렌드를 판단하고 거래 신호를 생성하며, 논리적으로 명확하고 구현하기 쉬운 특징을 가지고 있다. 동시에, 전략은 위험을 제어하기 위해 중지 지점을 설정한다. 그러나, 이 전략은 또한 일부 제한이 있다. 예를 들어, 트렌디 시장에만 적용되며, 파라미터 선택에 민감하다.
전략 소스 코드
/*backtest
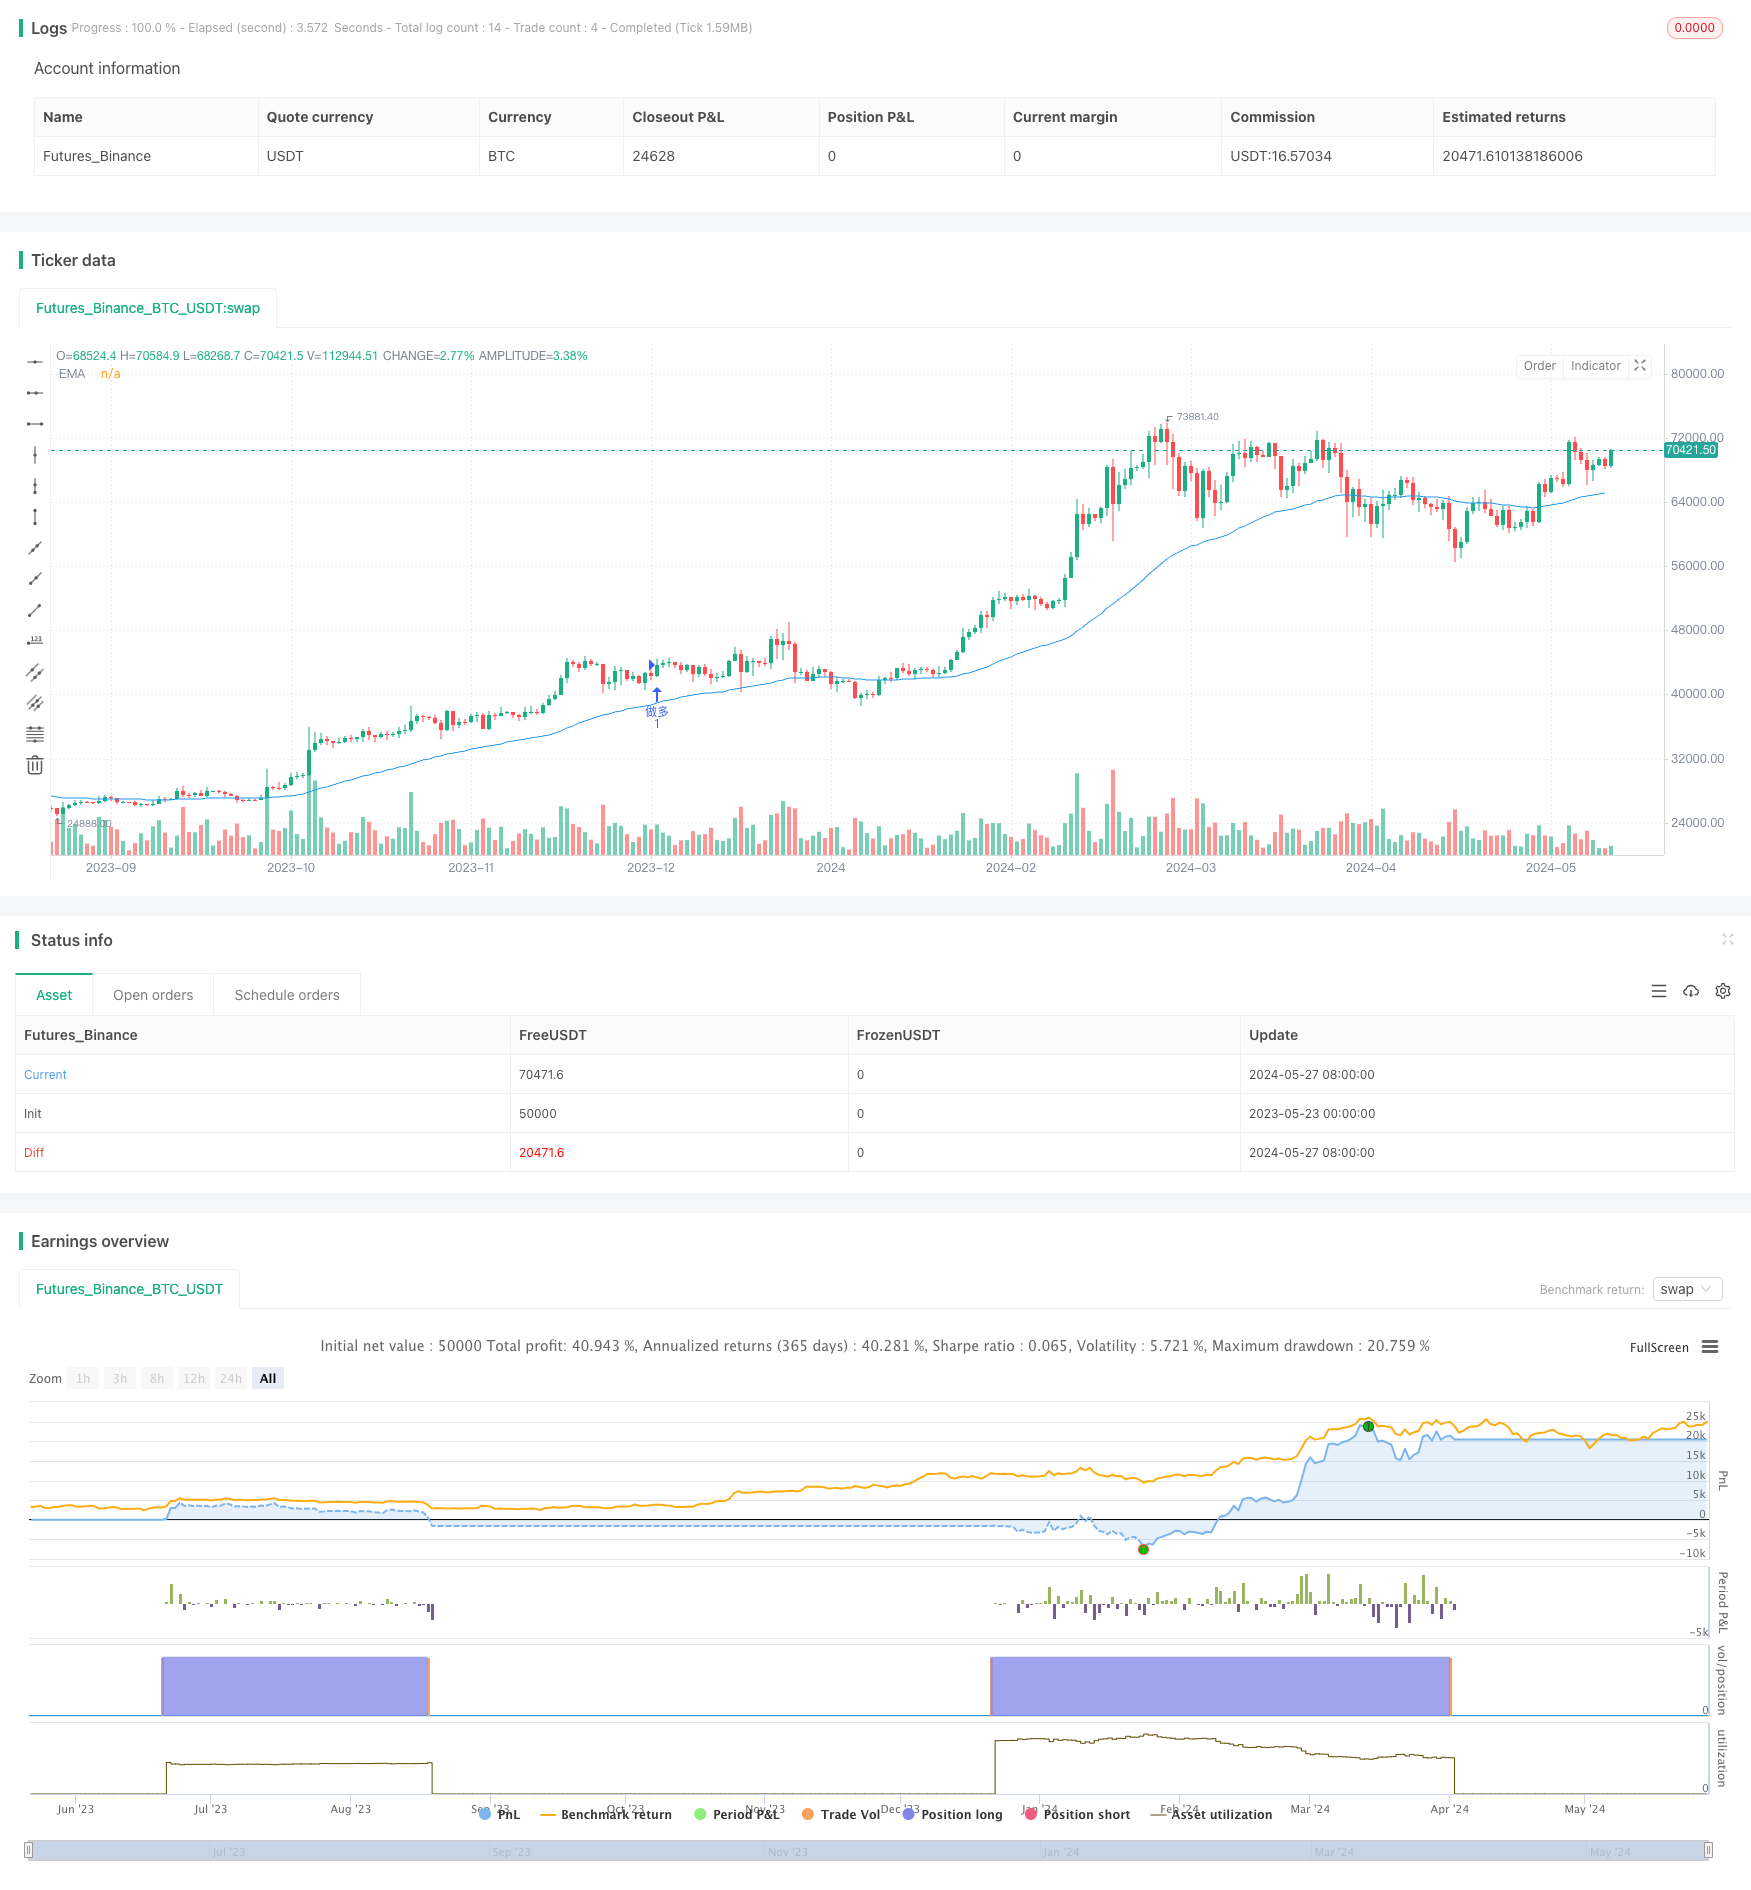
start: 2023-05-23 00:00:00
end: 2024-05-28 00:00:00
period: 1d
basePeriod: 1h
exchanges: [{"eid":"Futures_Binance","currency":"BTC_USDT"}]
*/
//@version=5
strategy("EMA & K-Pattern Trend Trading (Long Only)", overlay=true)
// 输入参数
emaLength = input.int(50, title="EMA长度")
aoShortLength = input.int(5, title="AO短期长度")
aoLongLength = input.int(34, title="AO长期长度")
stopLossPct = input.float(2, title="止损百分比") / 100 // 止损百分比
// 计算EMA和AO指标
ema = ta.ema(close, emaLength)
ao = ta.sma(high, aoShortLength) - ta.sma(low, aoLongLength)
// 定义趋势方向
isBullish = close > ema
// 定义K线形态
bullishK = close > open and close[1] < open[1] and open < close[1] and close > high[1] // 看涨吞没形态
// 定义买入信号
longCondition = bullishK and isBullish and ao > 0
// 绘制EMA
plot(ema, title="EMA", color=color.blue)
// 计算止损点
stopLossLevelLong = close * (1 - stopLossPct)
// 策略执行并标注信号
if (longCondition)
strategy.entry("做多", strategy.long)
label.new(bar_index, high, text="买入", style=label.style_label_up, color=color.green, textcolor=color.white)
strategy.exit("止损", from_entry="做多", stop=stopLossLevelLong)