동적 ATR 손절매 및 손절매 이동평균 교차 전략

1
Follow
1781
Followers
개요
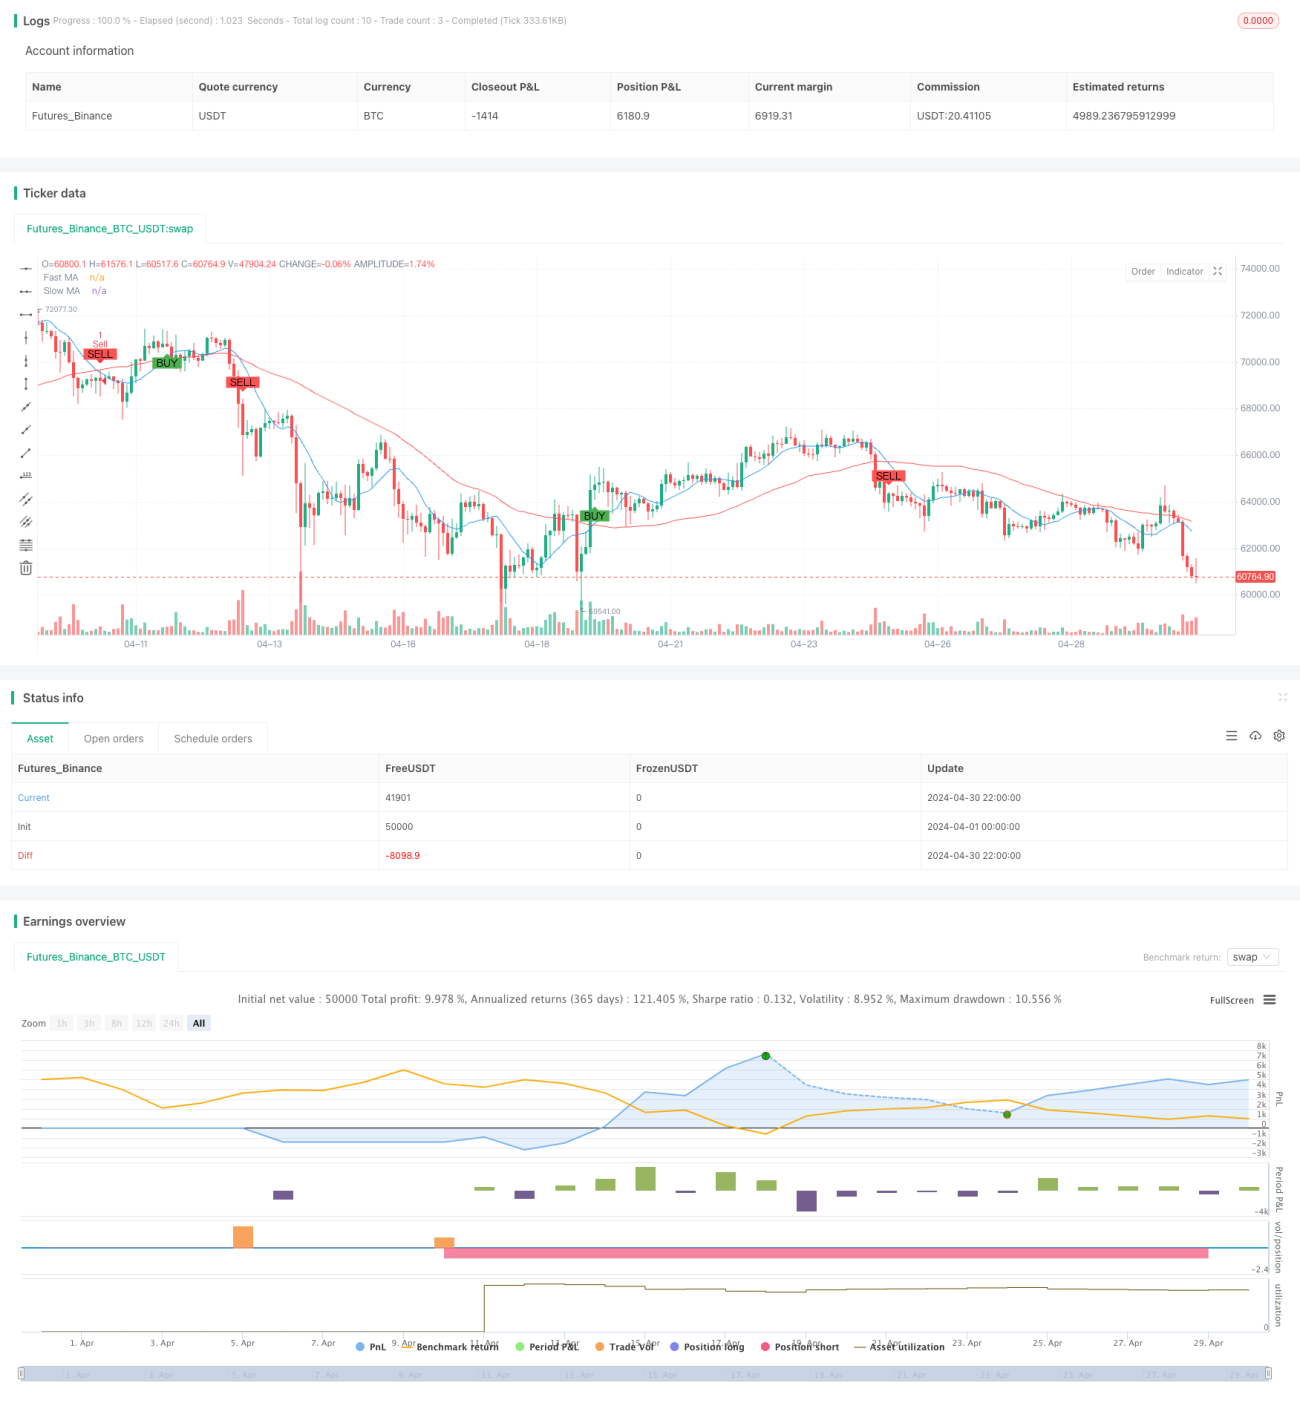
이 전략은 이동 평균의 교차와 동적 ATR 중지 손실을 기반으로 한 양적 거래 전략이다. 이 전략은 두 개의 다른 주기에서 간단한 이동 평균 ((SMA) 를 사용하여 거래 신호를 생성하고, 평균 실제 파동의 폭 ((ATR) 을 사용하여 위험 통제를 위해 중지 및 중지 위치를 동적으로 설정합니다. 또한, 이 전략은 전략의 안정성을 높이기 위해 다른 거래 시간에 따라 거래 신호를 필터링합니다.
전략 원칙
이 전략의 핵심 원칙은 이동 평균의 교차를 이용해서 가격 트렌드의 변화를 포착하는 것이다. 빠른 이동 평균이 아래에서 위로 느린 이동 평균을 통과할 때, 구매 신호를 생성한다. 빠른 이동 평균이 위에서 아래로 느린 이동 평균을 통과할 때, 판매 신호를 생성한다. 동시에, 이 전략은 ATR를 동적으로 사용해서 스톱과 스톱로스를 설정하고, 스톱로스는 입시 가격에 3배의 ATR을 추가하고, 스톱로스는 입시 가격에 1.5배의 ATR을 제거한다. 또한, 이 전략은 유럽 거래 시간대에만 거래 신호를 생성하여 유동성이 낮은 시간에 거래하는 것을 피한다.
전략적 이점
- 간단하고 이해하기 쉽다: 이 전략은 간단한 이동 평균과 ATR과 같은 일반적인 기술 지표를 사용하며, 전략 논리는 명확하고 이해하기 쉽고 구현된다.
- 동적 위험 제어: 동적으로 정지 및 정지 지점을 설정함으로써, 이 전략은 시장의 변동에 따라 스스로 위험을 제어할 수 있다.
- 시간 필터: 거래 시간을 제한함으로써, 이 전략은 유동성이 낮은 시간에 거래하는 것을 피할 수 있으며, 전략의 안정성을 향상시킵니다.
전략적 위험
- 매개 변수 최적화 위험: 이 전략의 성능은 이동 평균의 주기 선택과 ATR의 계산 주기에 의존하며, 다른 매개 변수 설정은 전략 성능에 큰 차이를 초래할 수 있으며, 매개 변수 최적화 위험이 있다.
- 트렌드 인식 위험: 이동 평균 크로스 전략은 흔들리는 시장에서 잘못된 신호가 더 많이 나타날 수 있으며, 전략이 좋지 않은 결과를 초래할 수 있습니다.
- 스톱로스 위험: 이 전략은 동적인 스톱로스를 설정하지만, 시장이 급격하게 변동하면 큰 손실이 발생할 수 있습니다.
전략 최적화 방향
- 신호 필터링: 신호 품질을 높이기 위해 거래 신호를 2차적으로 필터링하는 다른 기술 지표 또는 시장 감정 지표를 도입하는 것이 고려 될 수 있습니다.
- 동적 변수 최적화: 기계 학습 또는 자기 적응 알고리즘을 통해 전략 변수를 동적으로 조정하여 다른 시장 상태에 맞게 조정할 수 있습니다.
- 위험 관리 최적화: 전략적 위험을 더 제어하기 위해 변동율 조정, 동적 자금 분배 등과 같은 더 고급 위험 관리 기술을 도입 할 수 있습니다.
요약하다
이 전략은 간단하고 이해하기 쉬운 트렌드 추적 전략으로, 이동 평균을 교차하여 가격 트렌드를 포착하고 ATR을 사용하여 위험을 제어합니다. 이 전략에는 약간의 위험이 있지만, 매개 변수 최적화, 신호 필터링, 위험 관리 등의 측면에서 최적화를 통해 전략의 안정성과 수익성을 더욱 향상시킬 수 있습니다.
Source
Pine
Strategy parameters
Related strategies
Comment
All comments (0)
No data
- 1