개요
이 전략은 이치모쿠 쿠모 지표를 사용하여 시장의 추세와 거래 신호를 판단한다. 이 전략은 쿠모 구름 아래에서 더 많이 하고, 쿠모 구름 위에서 더 많이 한다. 이 전략은 ATR 지표를 스톱로 사용하며, 키-센 선과 센쿠 스팬 선의 돌파구를 입시 신호의 확인으로 사용한다. 이 전략은 강력한 추세에서 거래 기회를 잡으려고 하지만, 위험을 통제한다.
전략 원칙
- 이치모쿠 지표의 키준-센, 텐칸-센, 센코 스팬 라인을 사용하여 시장의 흐름을 판단한다.
- 종결 가격이 센코 스팬선 아래와 키-센선이 쿠모 구름 위를 지나면, 다중 신호가 발생한다.
- 종전 가격이 센코 스팬선보다 높고 키-센선이 쿠모 구름 아래 있을 때 코오피 신호가 발생한다.
- ATR 지수를 사용하여 중지 위치를 계산합니다. 중지 위치는 가장 가까운 5 K 선의 최고 / 낮은 지점 빼기 / 3 배의 ATR 입니다.
- 가격이 스톱로스를 돌파했을 때, 평지 포지션은 출발한다.
전략적 이점
- 이 전략은 이치모쿠 지표에 기반을 두고 있으며, 시장의 흐름을 종합적으로 분석할 수 있다.
- 이 전략은 가격과 키센 선과 센쿠 스판 선의 관계를 고려하여 입구 신호의 신뢰성을 높였다.
- ATR을 스톱로 사용하여 스톱 위치를 동적으로 조정하여 위험을 더 잘 제어 할 수 있습니다.
- 스톱 로즈의 설정은 시장의 변동성을 고려하여 다양한 시장 상황에 적응할 수 있습니다.
전략적 위험
- 이 전략은 불안정한 시장에서 더 많은 가짜 신호를 생성할 수 있으며, 이로 인해 거래가 빈번해지고 자금이 손실될 수 있다.
- 이 전략의 성과는 이치모쿠 지표의 매개 변수 선택에 의존하며, 다른 매개 변수는 다른 거래 결과를 초래할 수 있다.
- 급격한 상황에서는 가격이 스톱로스를 빠르게 돌파하여 큰 슬라이드 포인트와 손실을 초래할 수 있습니다.
전략 최적화 방향
- 다른 기술 지표 또는 수량 분석을 도입하여 트렌드와 진입 시기를 판단하여 신호의 정확성을 향상시킵니다.
- 트래킹 스톱 또는 이동 스톱을 사용하여 계정 보안을 더 잘 보호하기 위해 스톱 위치 설정을 최적화하십시오.
- 전략에 포지션 관리를 추가하고, 시장의 변동성과 계정 위험에 따라 각 거래의 포지션 크기를 조정한다.
- 전략에 대한 변수 최적화를 통해 현재 시장 상황에 가장 적합한 변수 조합을 찾습니다.
요약하다
이 전략은 이치모쿠 지표의 여러 구성 요소를 활용하여 시장 경향에 대한 전체적인 분석을 구현한다. 동시에, 이 전략은 ATR을 사용하여 위험을 제어하여 전략의 안정성을 강화한다. 그러나, 이 전략은 흔들리는 시장에서 좋지 않은 성능을 발휘할 수 있으며, 매개 변수 선택에 의존한다.
전략 소스 코드
/*backtest
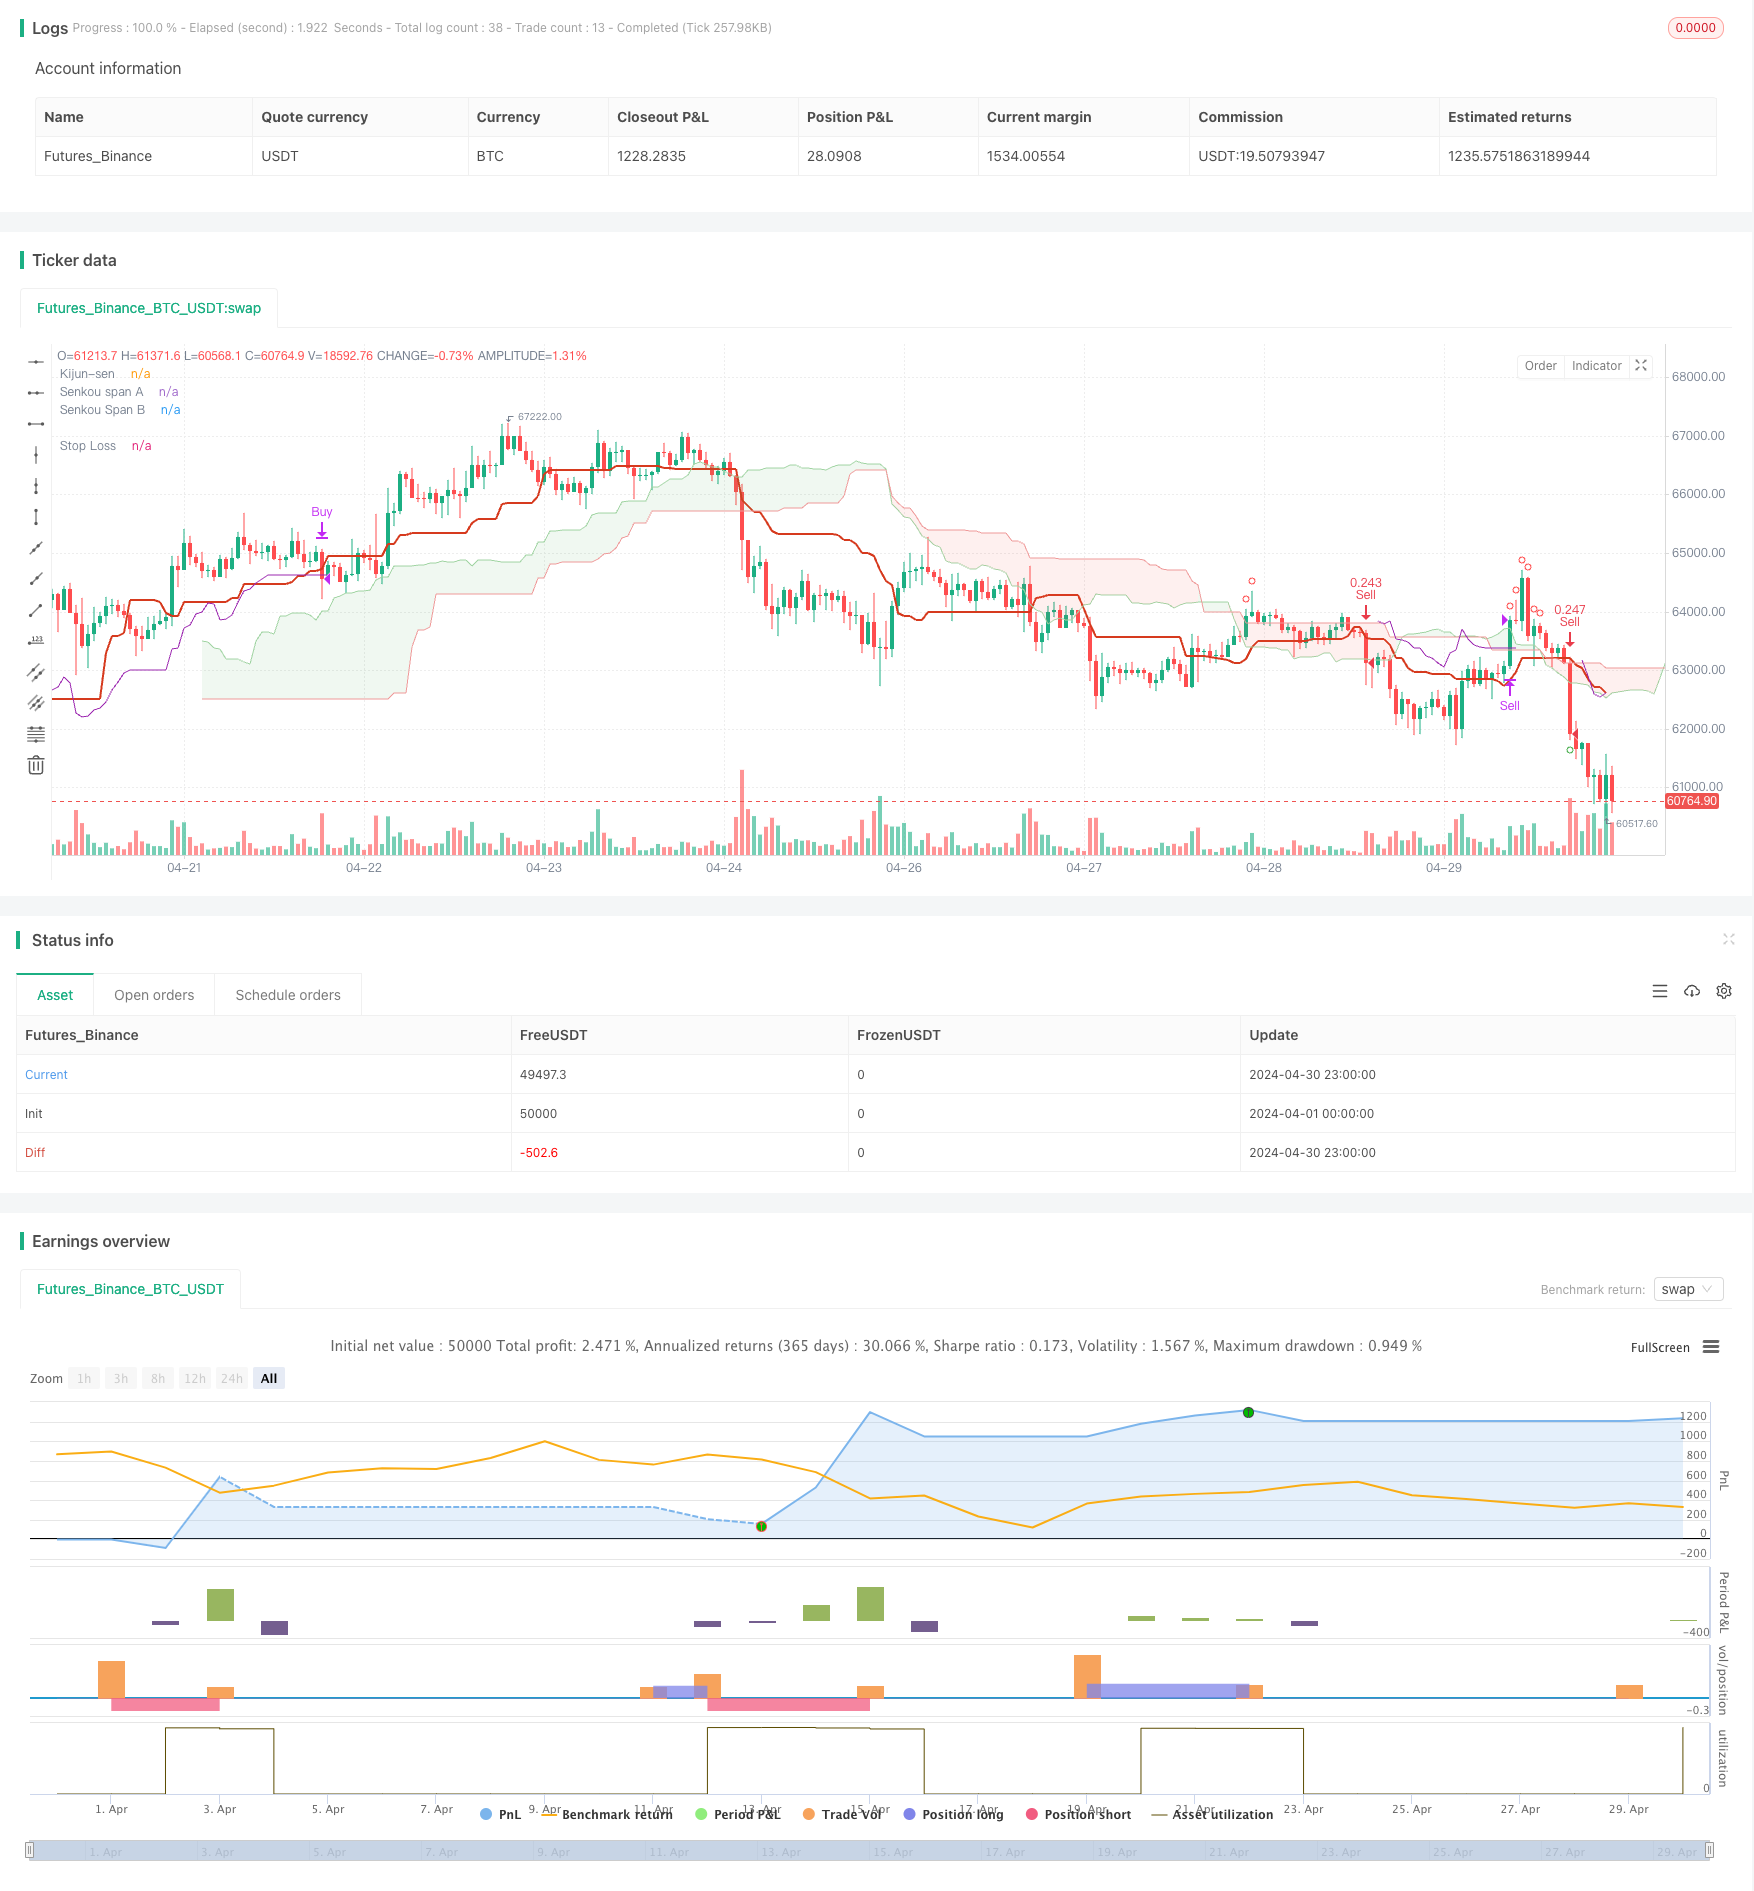
start: 2024-04-01 00:00:00
end: 2024-04-30 23:59:59
period: 1h
basePeriod: 15m
exchanges: [{"eid":"Futures_Binance","currency":"BTC_USDT"}]
*/
// This Pine Script™ code is subject to the terms of the Mozilla Public License 2.0 at https://mozilla.org/MPL/2.0/
// © muratatilay
//@version=5
strategy(
"Kumo Trade Concept",
overlay=true,
initial_capital=10000,
currency=currency.USDT,
default_qty_type=strategy.percent_of_equity,
default_qty_value=30,
commission_type=strategy.commission.percent,
commission_value=0.1,
margin_long=10,
margin_short=10)
// ICHIMOKU Lines
// INPUTS
tenkanSenPeriods = input.int(9, minval=1, title="Tenkan-sen")
kijunSenPeriods = input.int(26, minval=1, title="Kijun-sen")
senkouBPeriod = input.int(52, minval=1, title="Senkou span B")
displacement = input.int(26, minval=1, title="Chikou span")
donchian(len) => math.avg(ta.lowest(len), ta.highest(len))
tenkanSen = donchian(tenkanSenPeriods)
kijunSen = donchian(kijunSenPeriods)
senkouA = math.avg(tenkanSen, kijunSen)
senkouB = donchian(senkouBPeriod)
// Other Indicators
float atrValue = ta.atr(5)
// Calculate Senkou Span A 25 bars back
senkouA_current = math.avg(tenkanSen[25], kijunSen[25])
// Calculate Senkou Span B 25 bars back
senkouB_current = math.avg(ta.highest(senkouBPeriod)[25], ta.lowest(senkouBPeriod)[25])
// Kumo top bottom
senkou_max = (senkouA_current >= senkouB_current) ? senkouA_current : senkouB_current
senkou_min = (senkouB_current >= senkouA_current) ? senkouA_current : senkouB_current
// Trade Setups
long_setup = (kijunSen > senkou_max) and (close < senkou_min)
short_setup = (kijunSen < senkou_min ) and ( close > senkou_max )
// Check long_setup for the last 10 bars
long_setup_last_10 = false
for i = 0 to 50
if long_setup[i]
long_setup_last_10 := true
short_setup_last_10 = false
for i = 0 to 50
if short_setup[i]
short_setup_last_10 := true
closeSenkouCross = (close > senkou_max) and barstate.isconfirmed
closeKijunCross = (close > kijunSen )
senkouCloseCross = close < senkou_min
kijunCloseCross = close < kijunSen
// Handle Trades
// Enter Trade
var float trailStopLong = na
var float trailStopShort = na
if ( closeSenkouCross and long_setup_last_10 and closeKijunCross )
strategy.entry(id="Buy", direction = strategy.long)
trailStopLong := na
if senkouCloseCross and short_setup_last_10 and kijunCloseCross
strategy.entry(id="Sell", direction = strategy.short)
trailStopShort := na
// Update trailing stop
float temp_trailStop_long = ta.highest(high, 5) - (atrValue * 3)
float temp_trailStop_short = ta.lowest(low, 5) + (atrValue * 3)
if strategy.position_size > 0
if temp_trailStop_long > trailStopLong or na(trailStopLong)
trailStopLong := temp_trailStop_long
if strategy.position_size < 0
if temp_trailStop_short < trailStopShort or na(trailStopShort)
trailStopShort := temp_trailStop_short
// Handle strategy exit
if close < trailStopLong and barstate.isconfirmed
strategy.close("Buy", comment="Stop Long")
if close > trailStopShort and barstate.isconfirmed
strategy.close("Sell", comment="Stop Short")
// PRINT ON CHART
plot(kijunSen, color=color.rgb(214, 58, 30), title="Kijun-sen", linewidth=2)
p1 = plot(senkouA, offset=displacement - 1, color=#A5D6A7, title="Senkou span A")
p2 = plot(senkouB, offset=displacement - 1, color=#EF9A9A, title="Senkou Span B")
fill(p1, p2, color=senkouA > senkouB ? color.rgb(67, 160, 71, 90) : color.rgb(244, 67, 54, 90))
// PRINT SETUPS
plotshape(long_setup , style=shape.circle, color=color.green, location=location.belowbar, size=size.small)
plotshape(short_setup, style=shape.circle, color=color.red, location=location.abovebar, size=size.small)
// Trail Stop
plot(strategy.position_size[1] > 0 ? trailStopLong : na, style=plot.style_linebr, color=color.purple, title="Stop Loss")
plot(strategy.position_size[1] < 0 ? trailStopShort : na, style=plot.style_linebr, color=color.purple, title="Stop Loss")