RSI+Supertrend 추세 추종 거래 전략

1
Follow
1786
Followers
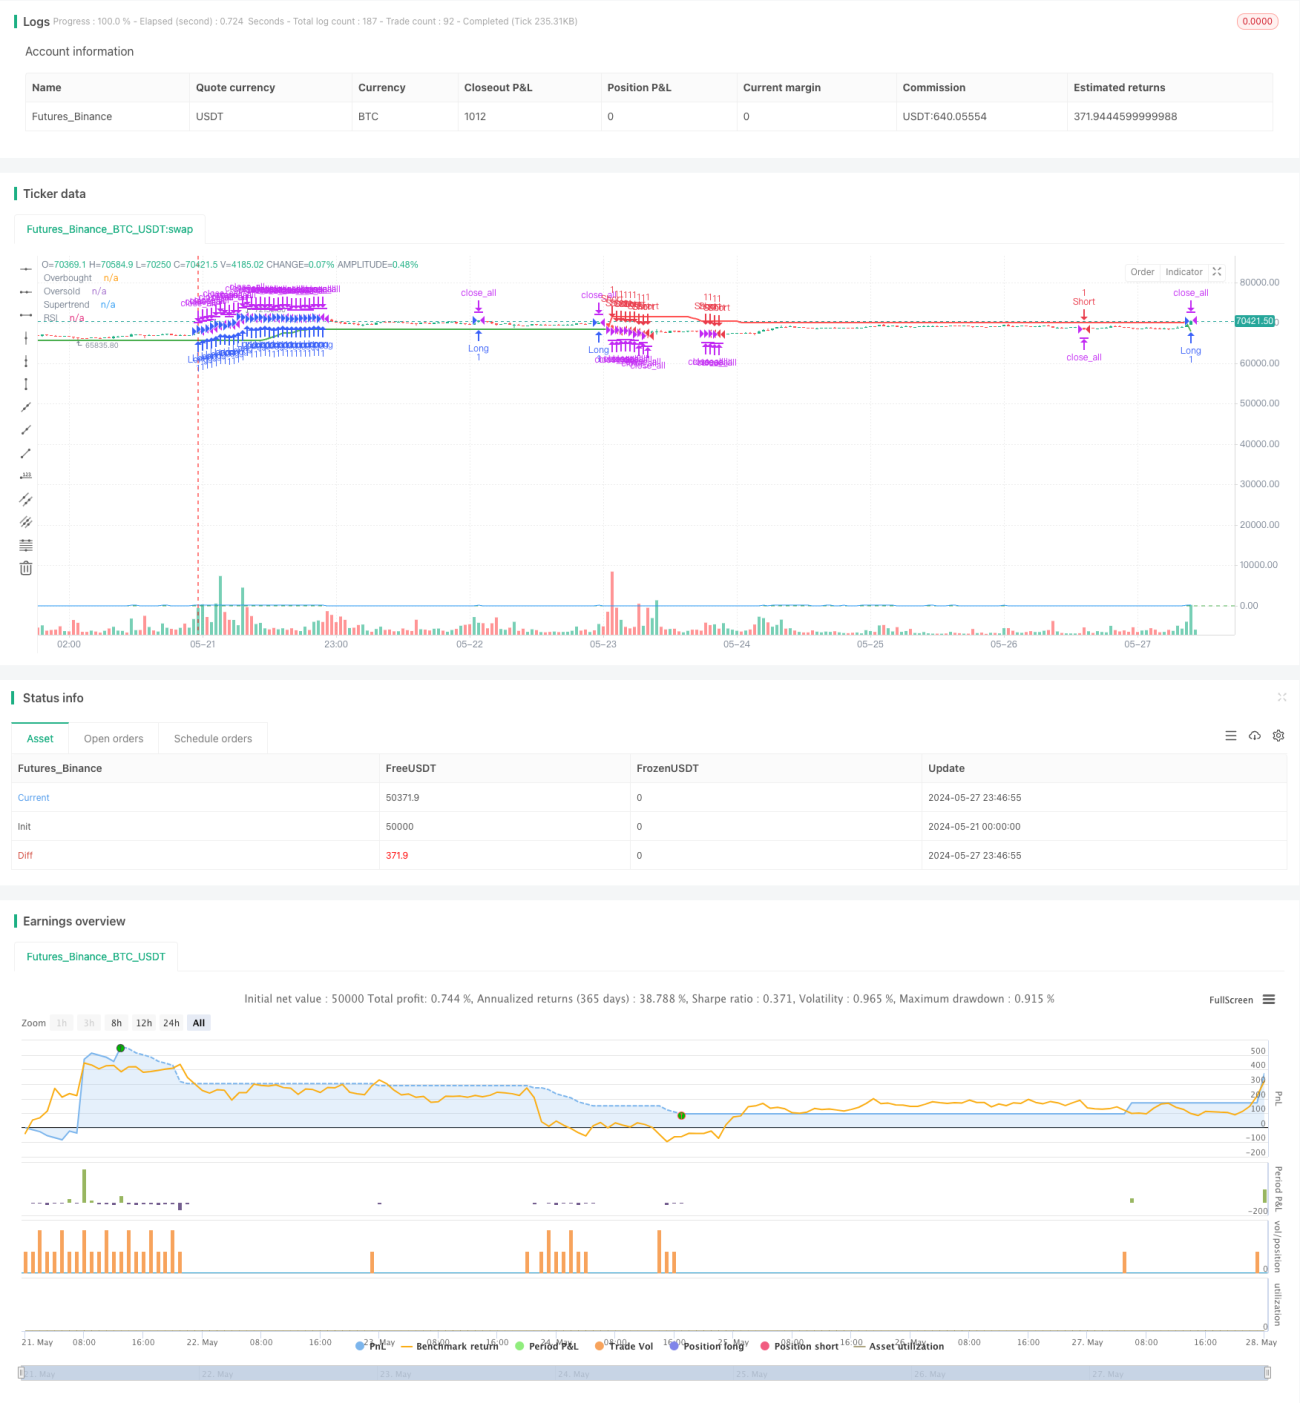
개요
이 전략은 상대적으로 강한 지수 ((RSI) 와 슈퍼트렌드 두 가지의 기술 지표를 결합하여 시장 추세를 포착하고 잠재적인 거래 기회를 식별합니다. 전략의 주요 아이디어는 RSI를 사용하여 시장의 과매매 및 과매매 상태를 판단하고, 동시에 슈퍼트렌드 지표를 사용하여 트렌드 방향을 확인합니다. RSI와 슈퍼트렌드 지표가 특정 조건을 동시에 충족하면 전략은 구매 또는 판매 신호를 발생시킵니다.
전략 원칙
- RSI와 슈퍼트렌드 지표의 값을 계산한다.
- RSI가 58을 넘어서서 슈퍼트렌드 지표가 녹색으로 표시되면 구매 신호가 발생하여 더 많은 위치를 열립니다.
- RSI가 50을 넘고 슈퍼 트렌드 지표가 빨간색으로 변하면 상위 포지션을 평행합니다.
- RSI가 38을 넘고 슈퍼트렌드 지표가 빨간색으로 표시되면 팔기 신호가 발생하고, 포지션을 공백하게 만듭니다.
- RSI가 45을 넘어서서 슈퍼트렌드 지표가 녹색으로 변할 때, 공백 포지션을 평면화하십시오.
우위 분석
- 동력 지표 ((RSI) 와 트렌드 지표 ((Supertrend) 를 결합하여, 시장 추세를 효과적으로 포착할 수 있다.
- RSI는 시장의 과매매와 과매매 현상을 식별하는 데 도움이 될 수 있으며, 극단적인 상황에서 거래를 피합니다.
- 슈퍼트렌드 지표는 트렌드 방향에 대한 명확한 신호를 제공하여 올바른 거래 결정을 내릴 수 있습니다.
- 전략의 논리는 명확하고, 이해하기 쉽고, 실행하기 쉽다.
위험 분석
- 불안정한 시장에서, 거래 신호의 빈도는 거래의 과도한 수와 수수료 비용으로 이어질 수 있다.
- RSI와 슈퍼트렌드 지표는 서로 상반된 신호를 생성할 수 있으며, 이는 전략의 효과를 떨어뜨릴 수 있다.
- 전략은 고정된 매개 변수 설정에 의존하며, 다른 시장 환경에 적응하지 못할 수 있다.
최적화 방향
- 전략의 신뢰성을 높이기 위해 이동 평균과 같은 다른 기술 지표를 도입하는 것을 고려하십시오.
- RSI와 Supertrend의 매개 변수를 최적화하여 다양한 시장 상황에 맞게 조정합니다.
- 잠재적인 손실을 통제하기 위해 위험 관리 조치와 같은 스톱 로즈 및 포지션 관리를 추가하십시오.
- 정책에 대한 피드백 및 실시간 모니터링, 정책 매개 변수를 적시에 조정한다.
요약하다
RSI+Supertrend 트렌드 추적 거래 전략은 RSI와 Supertrend의 두 가지 기술 지표를 결합하여 시장 추세를 효과적으로 포착하고 거래 신호를 생성합니다. 전략의 장점은 논리적으로 명확하고 실행하기 쉽고 동력과 트렌드 요소를 고려합니다. 그러나 전략에는 빈번한 거래와 매개 변수 설정의 한계와 같은 몇 가지 위험이 있습니다. 전략의 성능을 더욱 향상시키기 위해 다른 지표를 도입하고 매개 변수를 최적화하고 위험 관리 조치를 강화하고 지속적인 모니터링과 조정을 수행하는 것이 고려 될 수 있습니다.
Source
Pine
Strategy parameters
Related strategies
Comment
All comments (0)
No data
- 1