VWAP 및 SuperTrend 매수 및 매도 전략

1
Follow
1781
Followers
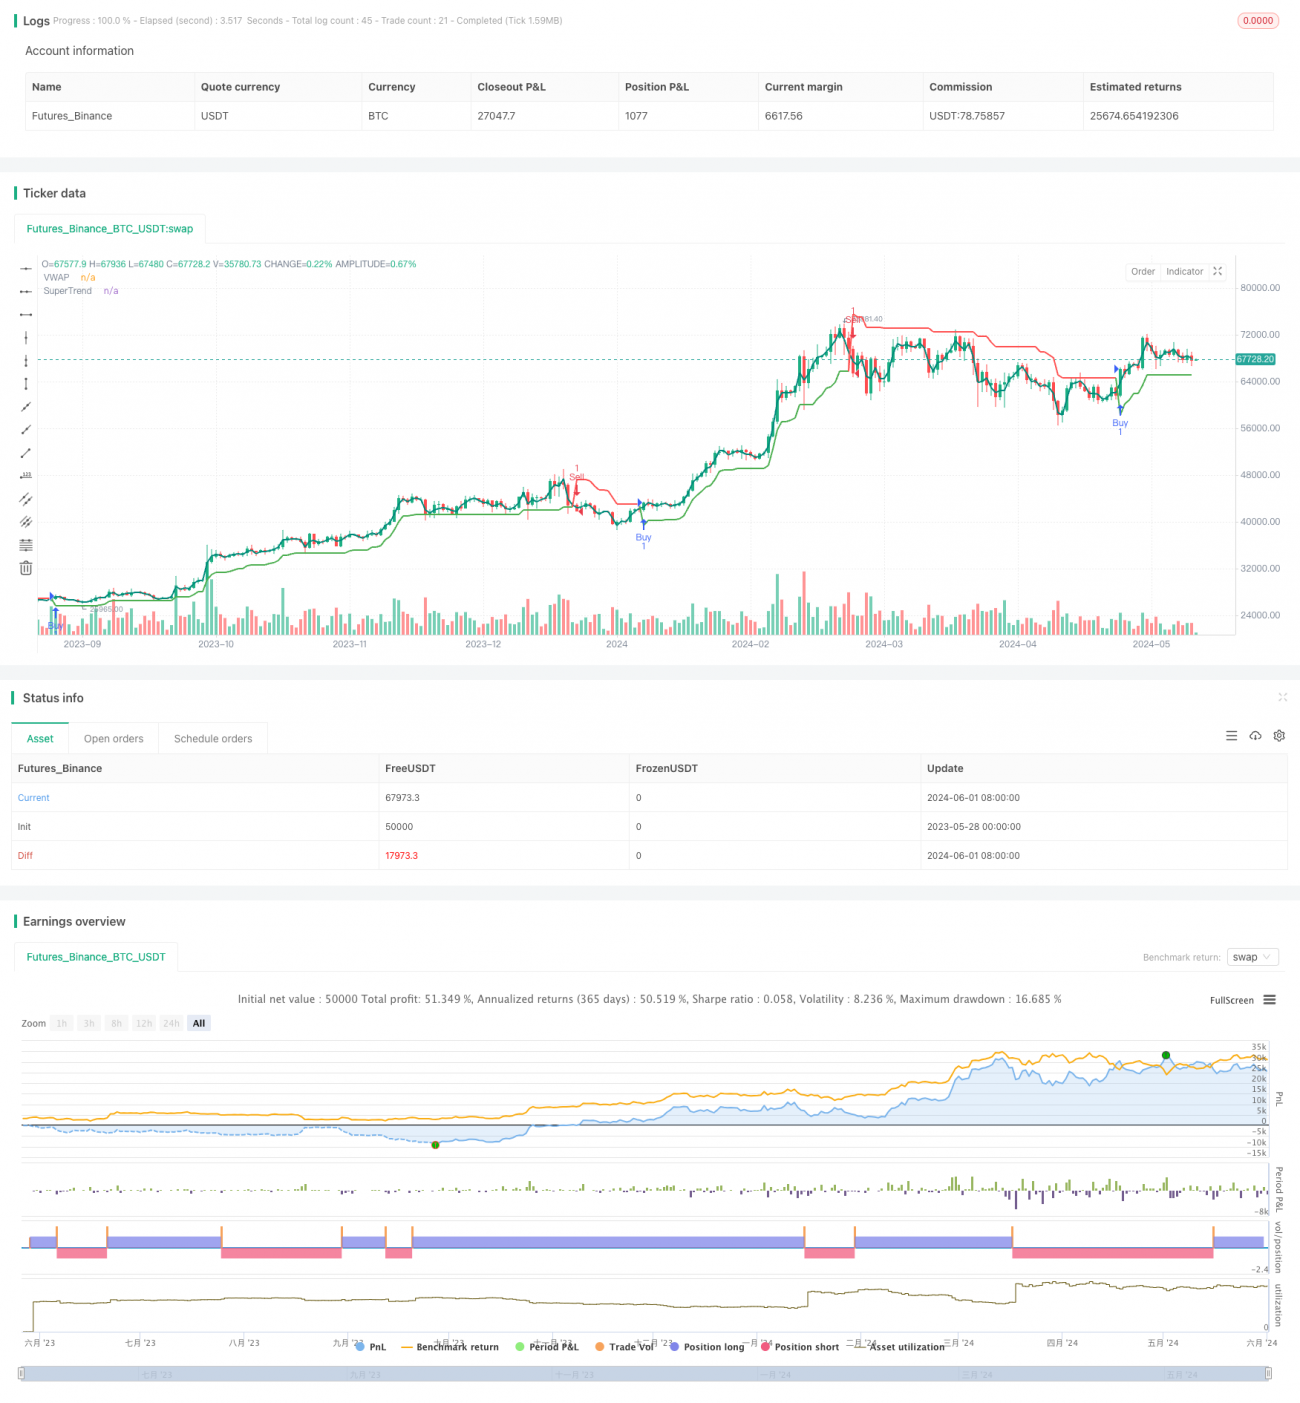
개요
이 전략은 VWAP (거래량 가중 평균 가격) 과 슈퍼 트렌드 지표를 결합한다. 가격과 VWAP의 상대적인 위치, 그리고 슈퍼 트렌드 지표의 방향을 비교하여 매매 신호를 판단한다. 가격이 VWAP를 넘어서서 슈퍼 트렌드가 긍정적일 때, 매매 신호를 생성한다. 가격이 VWAP를 넘어서서 슈퍼 트렌드가 부정적일 때, 매매 신호를 생성한다. 이 전략은 또한 지난 한 번의 신호 상태를 기록하여, 반대 방향으로의 신호가 나타날 때까지 반복되는 신호를 방지한다.
전략 원칙
- VWAP 지수를 계산하기 위해, ta.vwap 함수를 사용하여 VWAP의 길이를 사용자 정의 할 수 있습니다.
- 슈퍼 트렌드 지표를 계산하기 위해, ta.supertrend 함수를 사용하여 ATR 주기 및 곱수를 사용자 정의 할 수 있습니다.
- 구매 조건: 현재 가격에 VWAP를 착용하고, 슈퍼 트렌드가 긍정적이다.
- 판매 조건: 현재 가격 아래에서 VWAP를 뚫고 슈퍼 트렌드 방향이 마이너스이다.
- 마지막 신호의 상태를 기록하여 연속적으로 동방향 신호가 발생하지 않도록한다. 현재 신호가 이전 신호와 다르면만 새로운 거래 신호가 생성된다.
전략적 이점
- VWAP와 슈퍼 트렌드를 결합하면 시장의 추세와 잠재적 인 전환점을 더 포괄적으로 판단 할 수 있습니다.
- VWAP 지표는 거래량 요소를 고려하여 시장의 실제 흐름을 더 잘 반영합니다.
- 슈퍼 트렌드 지표는 트렌드 추적과 필터링 진동의 특징을 가지고 있으며, 주요 트렌드를 포착하는 데 도움이 됩니다.
- 반복되는 신호를 피함으로써 거래 빈도를 줄이고 거래 비용을 절감할 수 있다.
전략적 위험
- 이 전략은 시장의 변동이 많거나 추세가 불분명할 때 더 많은 가짜 신호를 생성할 수 있다.
- 전략의 성능은 VWAP와 슈퍼 트렌드 파라미터의 선택에 의존하며, 다른 파라미터 설정은 다른 결과를 초래할 수 있다.
- 이 전략은 위험 관리 및 포지션 통제를 고려하지 않고 실제 적용 시 다른 조치와 결합하여 위험을 통제해야 합니다.
전략 최적화 방향
- 트렌드 확인 메커니즘을 추가합니다. 예를 들어, 평균선이나 다른 트렌드 지표를 사용하여 신호를 더 필터링합니다.
- 최적화 변수 선택, 역사 데이터에 대한 재검토를 통해 최적의 VWAP 길이, ATR 주기 및 곱하기 조합을 찾습니다.
- 단편 거래의 위험을 통제하기 위해, 스톱로스 및 스톱을 설정하는 것과 같은 위험 관리 조치를 도입하십시오.
- 포지션 크기를 최적화하기 위해 고정 비율이나 케일리 공식과 같은 자금 관리 전략을 고려하십시오.
요약하다
VWAP와 슈퍼 트렌드 매매 전략은 두 가지 다른 유형의 지표를 결합하여 시장의 추세와 잠재적 인 전환점을 포괄적으로 포착하려고 노력합니다. 전략 논리는 명확하고 구현 및 최적화하기 쉽습니다. 그러나 전략의 성과는 매개 변수 선택에 의존하며 위험 관리 조치가 부족합니다. 실제 응용에서는 다양한 시장 환경과 거래 요구에 맞게 추가 최적화 및 개선이 필요합니다.
Source
Pine
Strategy parameters
Related strategies
Comment
All comments (0)
No data
- 1