볼린저 밴드 + RSI + 변동성 및 모멘텀 지표 기반 스토캐스틱 RSI 전략

개요
이 전략은 폴링거 대역, 상대적으로 약한 지수 ((RSI) 와 무작위 RSI의 세 가지 기술 지표를 결합하여 가격의 변동률과 동력을 분석하여 시장의 과매매 및 과매매 상태를 찾아 최적의 구매 및 판매 시기를 결정합니다. 이 전략은 20 배 배의 레버리지 모의 옵션 거래를 사용하여 0.60%의 중지 지점과 0.25%의 중지 지점을 설정하고 하루에 한 번 거래하는 것을 제한하여 위험을 제어합니다.
전략 원칙
이 전략의 핵심은 폴링 밴드, RSI, 그리고 무작위 RSI의 세 가지 지표를 사용하여 시장 상태를 평가하는 것입니다. 폴링 밴드는 중간 궤도 (중간 궤도 상단 3 표준 차) 과 상단 궤도 (중간 궤도 상단 3 표준 차) 와 하단 궤도 (중간 궤도 하단 3 표준 차) 로 구성되어 있으며, 가격의 변동률을 측정합니다. RSI는 과매 및 과매 조건을 식별하는 데 사용되는 동적 진동기입니다. 이 전략은 14 주기 RSI를 사용합니다.
RSI가 34보다 낮고, 임의의 RSI가 20보다 낮고, 그리고 종결 가격이 하향 궤도 근처 또는 하향 궤도 아래에 있을 때, 구매 신호를 유발한다. RSI가 66보다 높고, 임의의 RSI가 80보다 높고, 그리고 종결 가격이 상향 궤도 근처 또는 상향 궤도 위에 있을 때, 판매 신호를 유발한다. 이 전략은 20배의 레버리지 모의 옵션 거래를 사용하여, 중지 지점은 0.60이며, 중지 지점은 0.25%이다. 또한, 이 전략은 위험을 통제하기 위해 하루에 한 번만 거래한다.
전략적 이점
- 여러 기술 지표와 결합: 이 전략은 가격 변동률 (폴링거 대역) 과 동력 (RSI 및 무작위 RSI) 을 모두 고려하여 더 포괄적인 시장 분석을 제공합니다.
- 위험 제어: 전략은 명확한 스톱 및 스톱 손실을 설정하고 하루에 한 번만 거래하는 것을 제한하여 위험 <unk>을 효과적으로 제어합니다.
- 유연성: 이 전략은 폴링거 밴드의 표준 차차 배수, RSI 및 무작위 RSI의 마이너스 등과 같은 파라미터를 조정하여 다양한 시장 조건에 적응할 수 있습니다.
전략적 위험
- 시장 위험: 전략의 성과는 시장 조건에 따라 달라지며, 추세가 불명확하거나 변동성이 매우 높을 경우 전략이 좋지 않을 수 있다.
- 매개 변수 민감성: 전략의 효과는 선택된 매개 변수의 질에 달려 있으며, 매개 변수 설정이 잘못되면 정책의 성능이 좋지 않을 수 있다.
- 레버리지 위험: 이 전략은 20배의 레버리지를 사용한다. 이 전략은 수익을 증대시키지만 손실을 증대시키기도 한다. 극단적인 시장 조건에서 높은 레버리지는 큰 손실을 초래할 수 있다.
전략 최적화 방향
- 동적 조정 파라미터: 시장 상황의 변화에 따라, 폴링거 밴드의 표준 차이의 배수, RSI 및 무작위 RSI의 하락 등과 같은 파라미터를 동적으로 조정하여 다른 시장 환경에 적응합니다.
- 다른 지표를 포함: 전략의 신뢰성과 안정성을 높이기 위해 MACD, ADX 등과 같은 다른 기술 지표를 포함하는 것을 고려하십시오.
- 스톱 스톱 손실을 최적화: 재검토 및 최적화를 통해 최적의 스톱 스톱 손실 비율을 찾아서 위험을 제어하면서 수익을 극대화하십시오.
- 자금 관리 개선: 전략의 장기적 성능을 최적화하기 위해 케일리 가이드라인과 같은 더 고급 자금 관리 기술을 탐구하십시오.
요약하다
이 전략은 폴링그 띠, RSI 및 무작위 RSI의 3 가지 기술 지표를 결합하여 가격 변동률과 동력 정보를 사용하여 최적의 구매 및 판매 시점을 찾습니다. 전략은 명확한 중지 손실을 설정하고 매일 거래 횟수를 제어하여 위험을 관리합니다. 이 전략은 장점이 있음에도 불구하고 시장 위험, 파라미터 민감성 및 레버리지 위험과 같은 과제와 직면합니다.
/*backtest
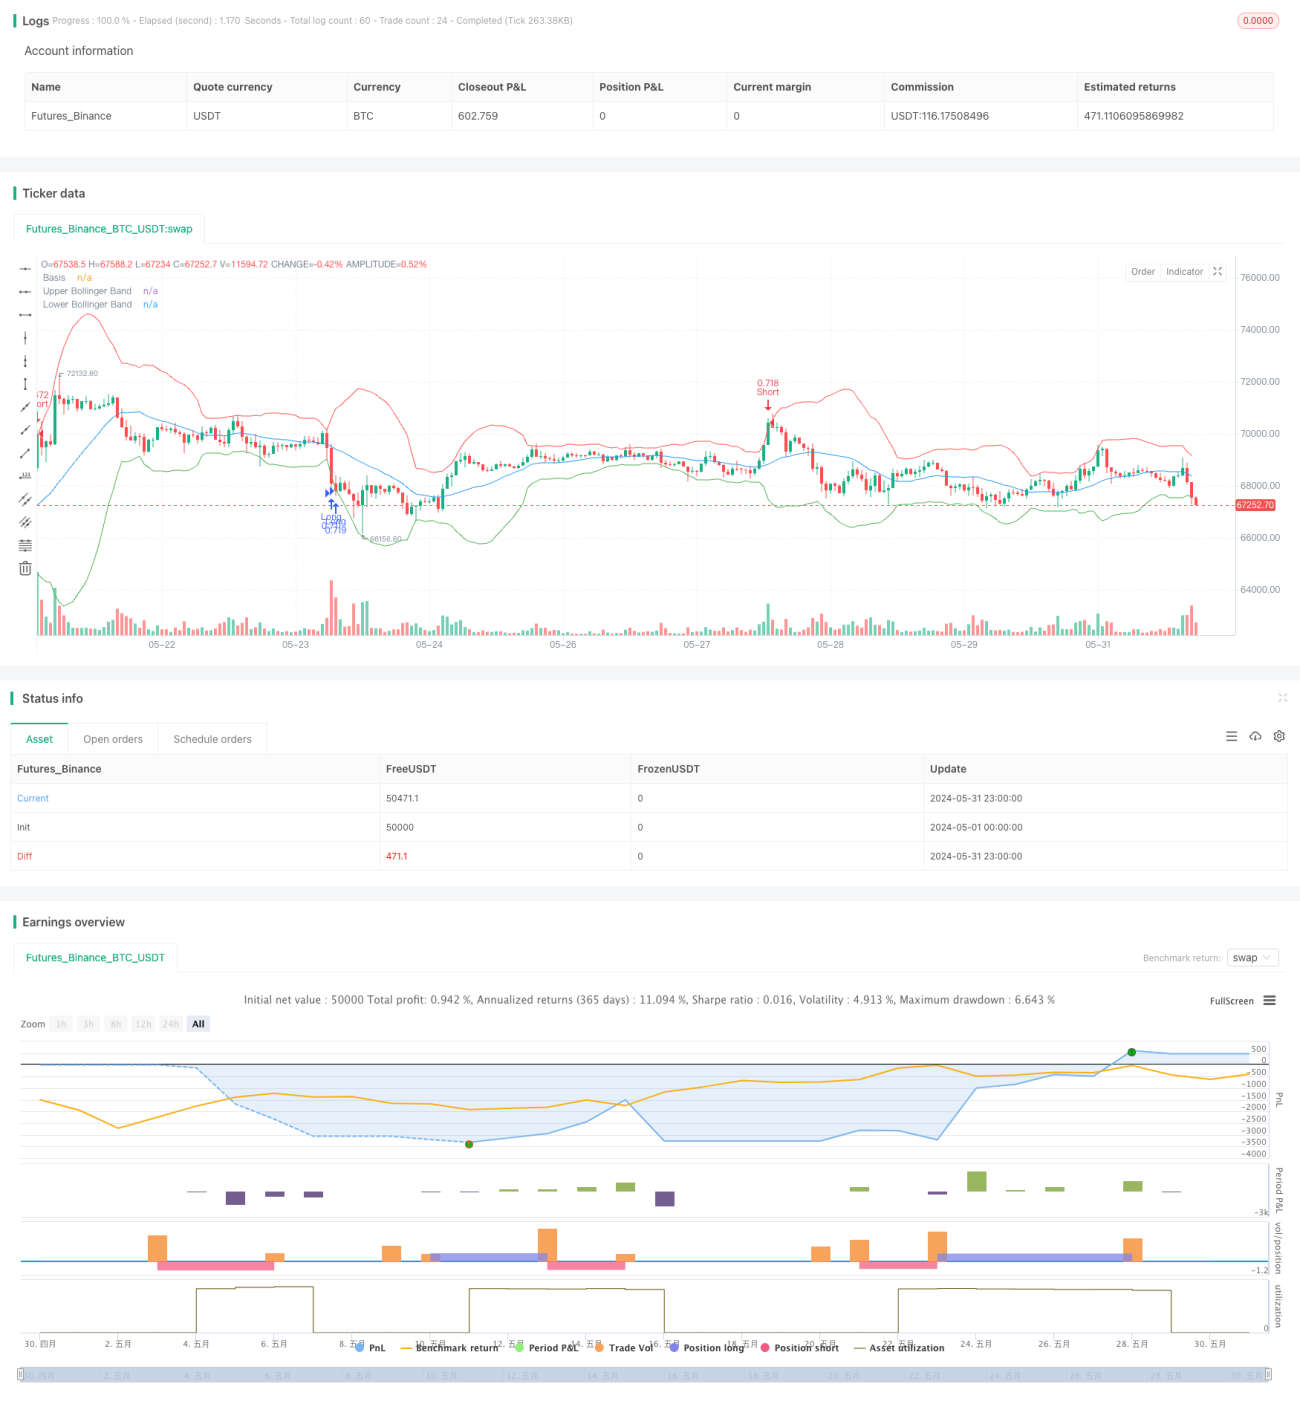
start: 2024-05-01 00:00:00
end: 2024-05-31 23:59:59
period: 1h
basePeriod: 15m
exchanges: [{"eid":"Futures_Binance","currency":"BTC_USDT"}]
*/
//@version=5
strategy("Bollinger Bands + RSI + Stochastic RSI Strategy with OTM Options", overlay=true)
// Define leverage factor (e.g., 20x leverage for OTM options)
leverage = 1 - 1