추세 추종과 모멘텀 필터링 거래 전략을 결합

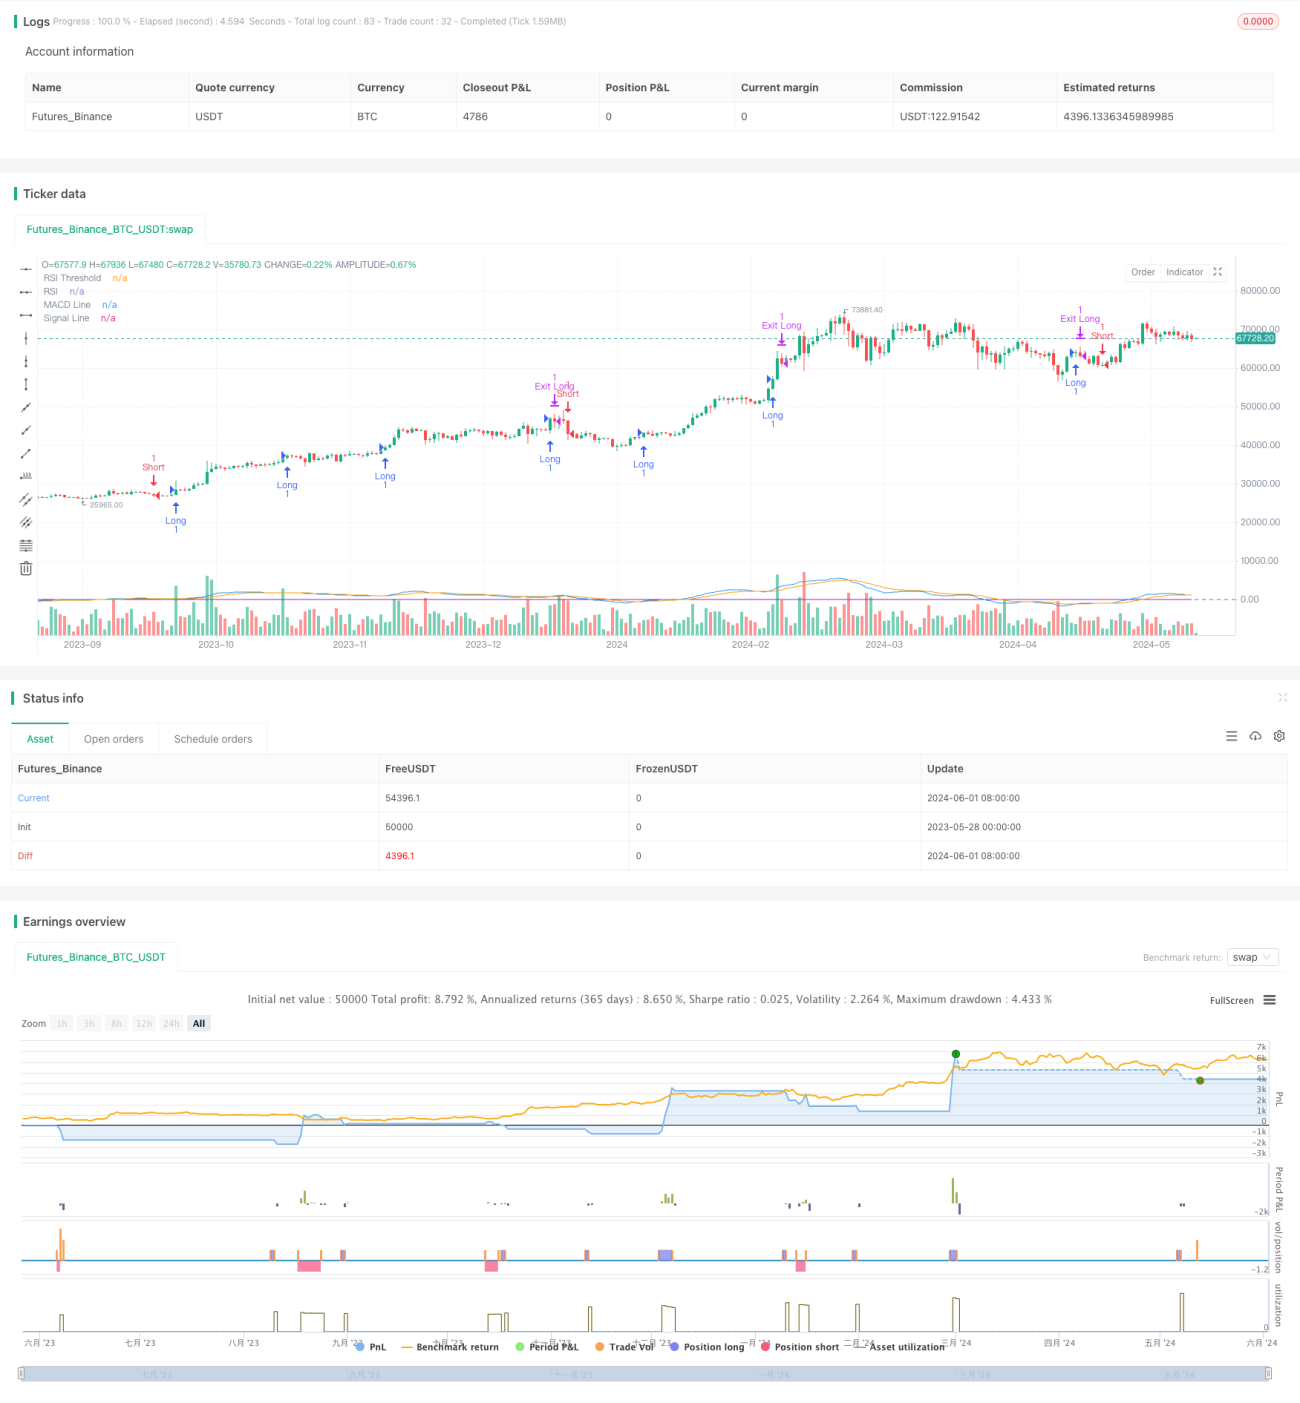
개요
이 전략은 이동 평균 (MA), 상대적으로 강한 지수 (RSI) 및 평균 실제 파장 (ATR) 과 같은 기술적 분석 도구를 결합하여 시장의 유행 기회를 잡기 위해 고안되었습니다. 이 전략은 쌍평등 선의 교차를 통해 트렌드 방향을 판단하고 RSI 지표를 사용하여 거래 신호에 대한 동력을 필터링하며 ATR을 손실 기준으로 사용하여 위험을 제어합니다.
전략 원칙
이 전략의 핵심은 두 개의 다른 기간의 이동 평균 ((빠른 선과 느린 선) 의 교차를 사용하여 시장의 흐름을 판단하는 것입니다. 빠른 선에서 느린 선을 통과하면 상승 추세를 나타냅니다. 전략은 다중 신호를 생성합니다. 반대로 빠른 선 아래에 느린 선을 통과하면 하향 추세를 나타냅니다. 전략은 공백 신호를 생성합니다.
거래 신호의 신뢰성을 높이기 위해, 전략은 동력 필터로 RSI 지표를 도입했다. RSI가 특정 한계 값 (예: 50) 보다 높을 때만 더 많은 포지션을 열 수 있으며, RSI가 그 한계 값보다 낮을 때만 빈 포지션을 열 수 있다.
또한, 전략은 ATR을 손실 근거로 사용하고, 최근 기간 동안의 가격 변동에 따라 스톱 포스를 동적으로 조정하여 다른 시장 상태에 적응합니다. 이러한 적응적 인 스톱 방식은 추세가 불명확할 때 신속하게 중지하고 철회를 제어 할 수 있습니다. 추세가 강할 때 더 많은 수익 공간을 제공하고 전략 수익을 높일 수 있습니다.
전략적 이점
- 트렌드 따라가기: 쌍평선 교차로로 시장 트렌드를 포착하여 시장의 주요 방향에 부응하여 전략 승률을 높일 수 있다.
- 동력 필터링: RSI 지표를 사용하여 거래 신호를 2차 확인하여 동력이 부족할 때 맹목적으로 입문하는 것을 피하고 단일 거래 품질을 향상시킵니다.
- 자율적 인 스톱: ATR의 동적 조정 스톱으로, 다른 시장 상태에서 위험을 자율적으로 조정하여 회수를 줄이고 자금 활용 효율성을 높일 수 있습니다.
- 간단하고 사용하기 쉬운: 전략 논리가 명확하고, 파라미터가 적고, 이해하기 쉽고, 대부분의 투자자들이 사용할 수 있도록 구현하기 쉽습니다.
전략적 위험
- 흔들리는 시장 위험: 움직임이 반복적으로 흔들리고, 추세가 불명확할 때, 자주 교차하는 것은 전략이 더 많은 거래 신호를 생성하도록 만들 수 있으며, 이는 빈번한 거래와 자금의 급속한 손실을 유발할 수 있다.
- 매개 변수 위험: 정책의 성능은 매개 변수 설정에 민감하며, 다른 매개 변수는 완전히 다른 결과를 가져올 수 있다. 매개 변수가 잘못 선택되면 정책이 무효화될 수 있다.
- 트렌드 변동 위험: 시장이 급격하게 변하고, 트렌드가 급격히 변하면, 전략은 막상 손실을 미치지 못하고 큰 손실을 입을 수 있습니다.
- 전체적 위험: 이 전략은 동력 필터링을 추가했지만, 전체적으로 여전히 추세 전략이며, 시장의 장기적인 흔들림이나 추세가 분명하지 않을 때 체계적 위험에 직면할 수 있습니다.
전략 최적화 방향
- 트렌드 강도 식별: 트렌드 판단에 기초하여 트렌드 강도 지표 (ADX와 같은) 를 추가로 도입하여, 약한 트렌드 아래에서 자주 거래하는 것을 피하고 트렌드 파악의 정확성을 향상시킬 수 있습니다.
- 다공동량 분화: 기존 전략은 다공동 신호에 동일한 동력 필터링 방식을 취하고 있으며, 다공동체와 공소체에 대해 각각 다른 RSI 마이너스 값을 설정하는 것이 고려될 수 있으며, 다공동체 트렌드의 비대칭성에 더 잘 적응합니다.
- 손해 차단 최적화: ATR 손해 차단에 기초하여, 다른 손해 차단 방법 (퍼센트 차단, 지지/저항 위치 차단 등) 과 결합하여, 다채로운 손해 차단 시스템을 구축하여 위험을 더욱 제어 할 수 있습니다.
- 매개 변수 적응: 매개 변수 최적화 또는 매개 변수 적응 알고리즘을 도입하는 것을 고려하여 전략 매개 변수가 시장 상태의 변화에 따라 자동으로 조정되어 전략의 적응성과 안정성을 향상시킵니다.
요약하다
이 전략은 트렌드 추적과 동력 필터링의 유기적인 결합을 통해 시장의 트렌디한 기회를 포착하면서 위험을 더 잘 제어한다. 전략 논리는 명확하고 구현 및 최적화하기 쉽습니다. 그러나 실제 응용에서는 여전히 흔들림 시장 위험과 변수 위험에 주의를 기울이고 시장 특성과 자체 요구에 따라 유연하게 조정 및 최적화 전략이 필요합니다.
- 1