연속 K-라인 동적 그리드 적응 이동 평균을 기반으로 한 동적 손절매 전략

1
Follow
1780
Followers
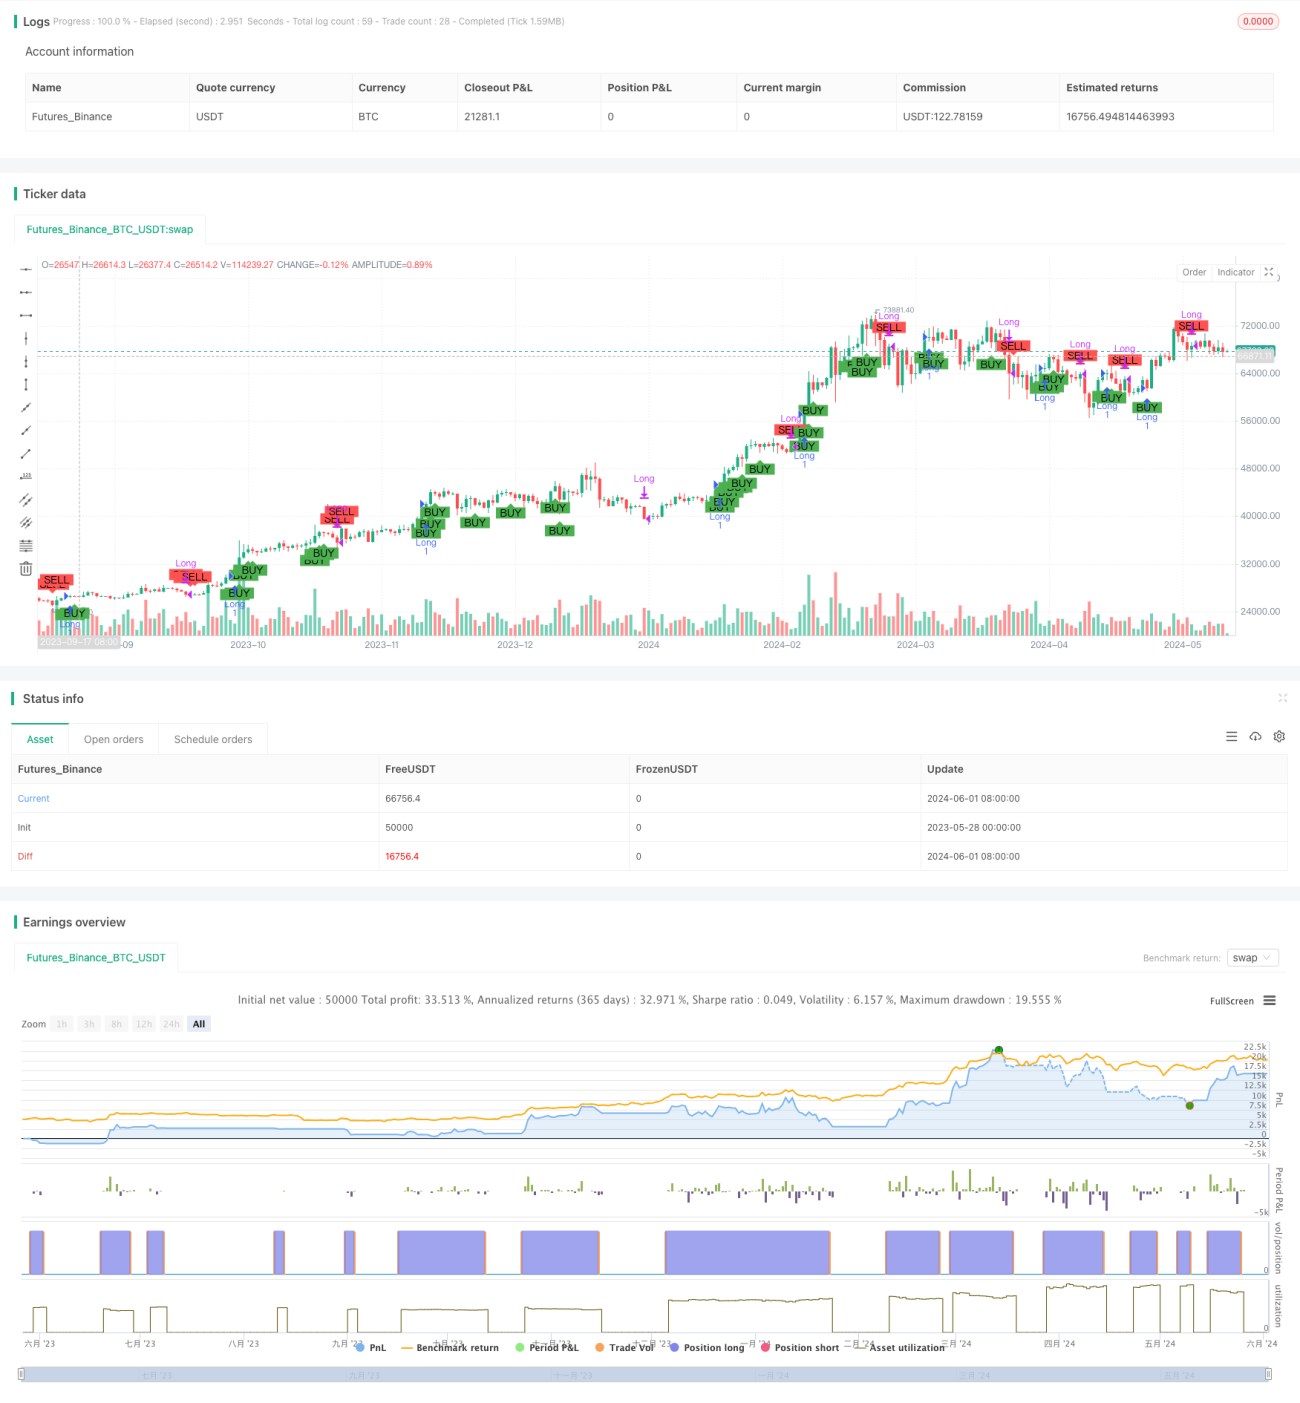
개요
이 전략은 연속적인 K 선의 움직임을 기반으로, 현재 종료 가격과 이전 3개의 K 선의 종료 가격을 비교하여 입장을 여부를 판단한다. 연속적인 3개의 K 선이 상승할 때 다중 입장을 개시하고, 반대로 평점이다. 동시에, 이 전략은 동적 중지 손실을 사용하는 방법을 채택하고, 포지션 개시 가격과 설정된 중지 손실 비율에 따라 중지 손실을 결정한다. 이 방법은 스톱 손실을 동적으로 조정하여 위험을 더 잘 제어 할 수 있다.
전략 원칙
- 현재 종결 가격과 앞의 세 K선 종결 가격을 비교하여 연속적으로 세 K선 상승 또는 하락의 조건을 충족하는지 판단한다.
- 만약 연속적으로 3개의 K선들이 올라가는 조건이 충족된다면, 4번째 K선들이 열릴 때 다중 상점 상장을 한다.
- 포지션 개시 후, 포지션 개시 가격과 설정된 중지 손실 비율에 따라 중지 손실을 계산합니다.
- 3개의 연속적인 K선 하락 조건이 충족되거나 가격이 스톱로스 지점을 만지면 평점이다.
전략적 이점
- 이 전략은 연속적인 K 선의 움직임을 바탕으로 판단하여 시장의 유행 기회를 잡을 수 있다.
- 다이내믹 스톱 (Dynamic Stop) 방식은 포지션 개시 가격과 스톱 퍼센티지에 따라 실시간으로 스톱 레벨을 조정하여 위험을 더 잘 제어할 수 있다.
- 전략의 논리는 명확하고, 이해하기 쉽고, 실행하기 쉽다.
- 다양한 시장과 품종에 적합하며, 어느 정도 보편성이 있다.
전략적 위험
- 이 전략은 연속적인 K 선의 움직임을 판단하는 데 의존하며, 시장의 흔들림이나 비 트렌드적 행태가 발생하면, 거래 비용이 증가하는 빈번한 평점 포지션이 발생할 수 있다.
- 스톱 로즈의 설정은 스톱 비율의 선택에 의존하며, 잘못 선택하면 너무 일찍 또는 너무 늦게 스톱 로즈가 발생하여 전략의 성과에 영향을 줄 수 있다.
- 이 전략은 거래 품종의 특성을 고려하지 않고 실제 응용에서 상황에 따라 조정할 필요가 있습니다.
전략 최적화 방향
- 이동 평균, MACD 등과 같은 더 많은 기술적 지표를 도입하여 평형 포지션의 정확성을 높이기 위해 보조 판단 조건으로 사용합니다.
- 손실 비율에 대한 변수 최적화, 최적의 손실 설정을 찾아, 전략의 위험 제어 능력을 향상한다.
- 포지션 관리의 논리를 고려하여 시장의 변동성, 계좌 자금 등의 요인에 따라 포지션을 동적으로 조정하여 자금 사용 효율을 높여라.
- 다양한 거래 유형과 시장 특성에 맞게 전략 매개 변수를 개별적으로 최적화하여 전략의 적응성을 향상시킵니다.
요약하다
이 전략은 연속적인 K 선의 움직임을 판단하여 평형 포지션을 결정하고 동시에 동적 상쇄 방법을 사용하여 위험을 제어합니다. 전략 논리는 명확하고 이해하기 쉽고 구현할 수 있으며 여러 시장과 품종에 적용됩니다. 그러나 실제 응용에서는 시장의 비 트렌드적 위험에 주의를 기울이고 상쇄 비율과 같은 매개 변수를 최적화해야합니다. 또한, 더 많은 기술 지표, 포지션 관리 등의 방법을 도입하면 전략 성능을 더욱 향상시킬 수 있습니다.
Source
Pine
Strategy parameters
Related strategies
Comment
All comments (0)
No data
- 1