볼륨 가격 신호와 캔들스틱 패턴을 기반으로 한 매수 및 매도 전략

1
Follow
1781
Followers
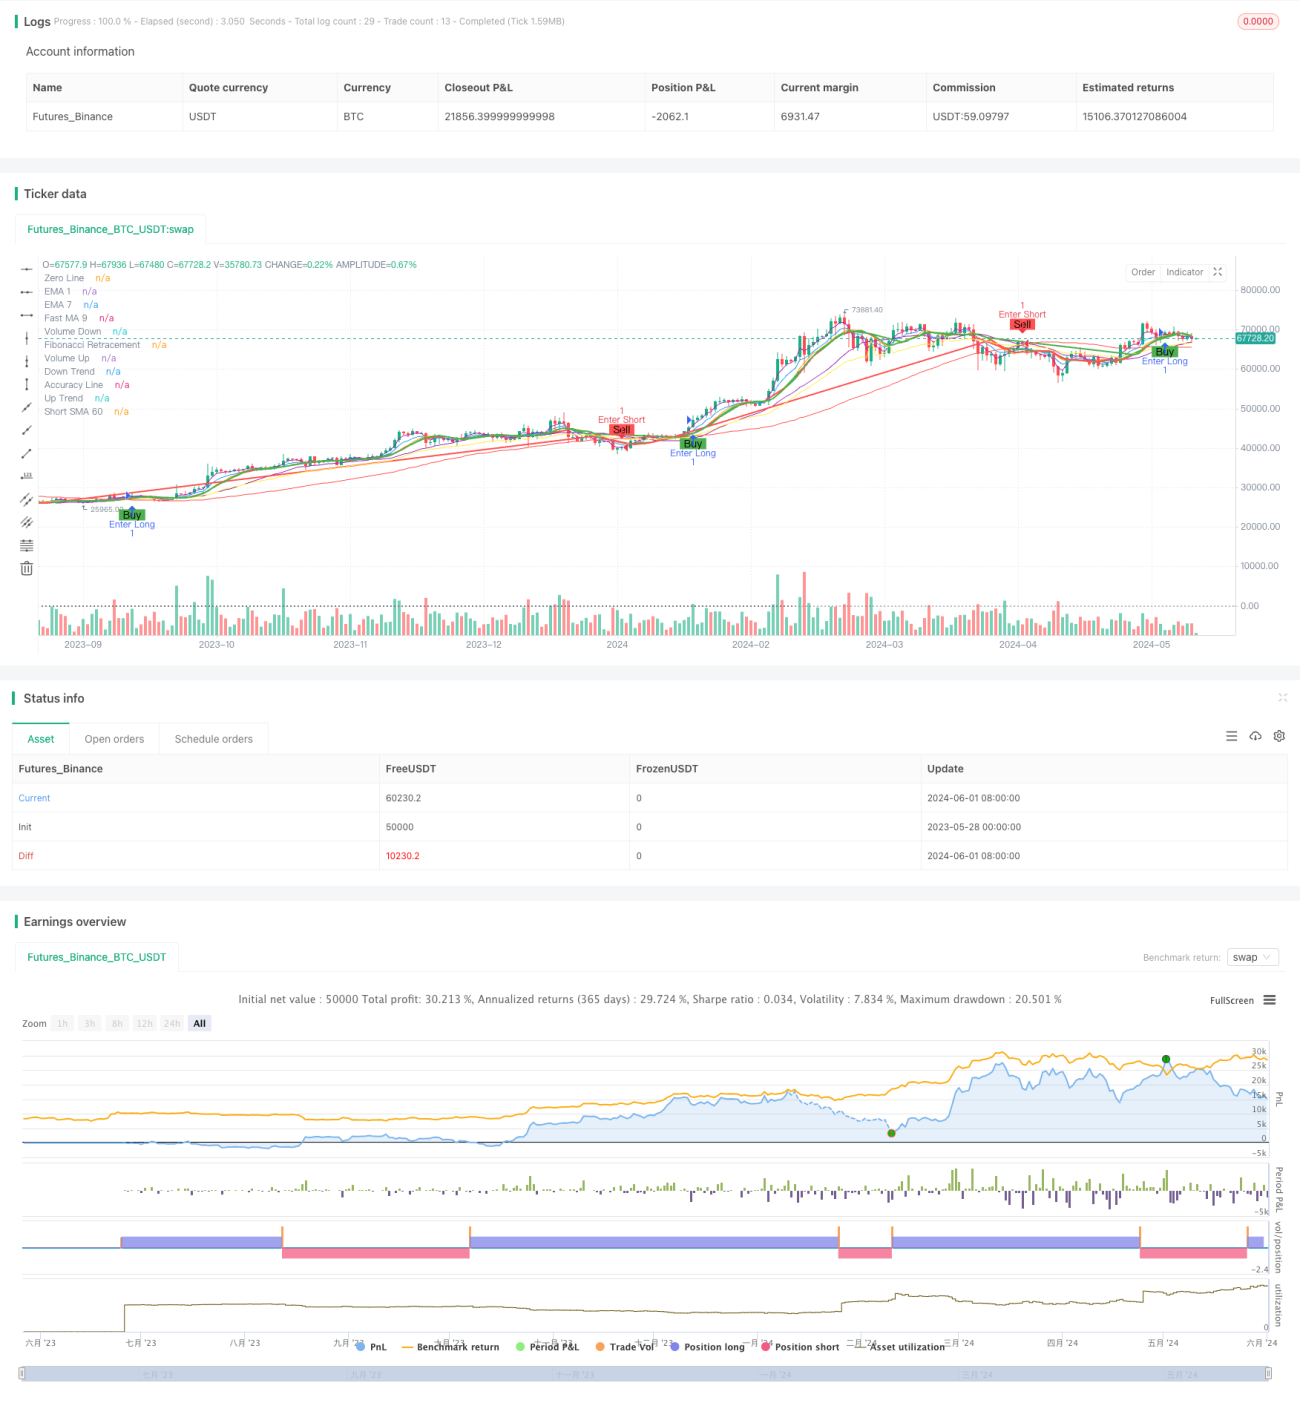
개요
이 전략은 가격과 거래량 신호와 피보나치 회귀 수준을 결합하여 15분과 45분 시간 프레임에 걸쳐 매매 신호를 발생시킨다. 이 전략은 여러 이동 평균 (MA) 을 단순 이동 평균 (SMA) 과 지수 이동 평균 (EMA) 을 포함한 추세와 움직임의 지표로 사용한다. 또한 피보나치 회귀 수준을 잠재적인 진입 지점으로 사용한다. 이 전략의 주요 목표는 가격과 거래량이 눈에 띄게 변할 때 매매 기회를 잡는 것이다.
전략 원칙
- 계산 빠른 MA (기본 10) 과 느린 MA (기본 30) 은 빠른 MA가 느린 MA보다 높을 때 상승세를 나타내고, 반대로 하향세를 나타냅니다.
- 계산 거래량 MA ((비용 20)), 현재 거래량이 거래량 MA보다 높다는 것은 거래량이 증가했다는 것을 나타내고, 반대로 거래량이 감소했다는 것을 나타냅니다.
- 여러 MA와 EMA를 보조 지표로 사용한다. 급속한 MA (기본 9), 단기 SMA (기본 10와 60), EMA (기본 3와 7) 등이 있다.
- 피보나치 회귀 레벨을 계산하기 (0.47, 0.658 및 0.886), 잠재적인 지지점과 저항점으로.
- 단기 SMA ((60)) 가 정확도 라인 ((고속 EMA와 느린 EMA의 교차에 기초한) 과 교차할 때 구매 또는 판매 신호를 생성한다.
- 빠른 MA(9) 와 EMA(7) 가 교차할 때 평점 신호가 발생한다.
우위 분석
- 가격과 거래량 정보를 결합하여 더 포괄적인 시장 분석을 제공합니다.
- 여러 MA와 EMA를 보조적인 지표로 사용하여 추세와 동력의 변화를 확인하는 데 도움이 됩니다.
- 피보나치 회수수준은 잠재적인 진출 지점에 대한 참고 자료를 제공하고, 진출 시기를 최적화하는데 도움을 준다.
- 구매/판매 신호는 단기 SMA와 정밀도 선의 교차에 기반하여 시장의 전환점을 적시에 포착하는 데 도움이 됩니다.
- 평지 신호는 빠른 MA와 EMA의 교차에 기초하여, 적시에 이익 또는 손실을 차단하는 데 도움이 된다.
위험 분석
- 불안한 시장에서, 자주 교차하는 신호는 과도한 거래와 수수료 손실을 초래할 수 있다.
- 전략은 MA와 피보나치치 수준에 의존하는 역사적 데이터로, 시장의 급격한 변화에 적절히 적응하지 못할 수 있다.
- 전략은 시장 추세의 강도를 평가하지 못하여 추세가 약할 때 잘못된 신호를 줄 수 있습니다.
- 전략의 매개 변수 (MA 주기와 같은) 는 다른 시장 상황에 따라 최적화되어야 하며, 그렇지 않으면 전략의 유효성에 영향을 줄 수 있다.
최적화 방향
- 트렌드 강도 지표 (ADX와 같은) 를 도입하고, 트렌드가 약할 때 거래를 피하거나 더 보수적인 전략을 취한다.
- 다른 시장 상황과 거래 품종에 적응하기 위해 MA와 EMA의 주기적 매개 변수를 최적화하십시오.
- 다른 기술 지표 (RSI, MACD 등) 와 결합하여 신호의 신뢰성을 높인다.
- 단편 거래의 위험 허브를 제어하기 위해 스톱로스 및 스톱 스톱 메커니즘을 도입하십시오.
- 불안한 시장에서는 좀 더 적절한 거래 전략을 고려하십시오.
요약하다
이 전략은 가격, 거래량 및 피포나치 회수 수준을 결합하여 여러 시간 프레임에 걸쳐 매매 신호를 생성합니다. 전략의 장점은 여러 시장 요소를 종합적으로 고려하고 여러 MA와 EMA를 보조 지표로 사용하는 것입니다. 그러나 전략은 불안한 시장에서 과도한 거래 신호를 생성 할 수 있으며, 역사적 데이터 계산 된 지표에 의존하므로 적합성과 신뢰성을 높이기 위해 추가적인 최적화가 필요합니다.
Source
Pine
Strategy parameters
Related strategies
Comment
All comments (0)
No data
- 1