이중 이동평균선 교차를 기반으로 한 이동평균선 전략

개요
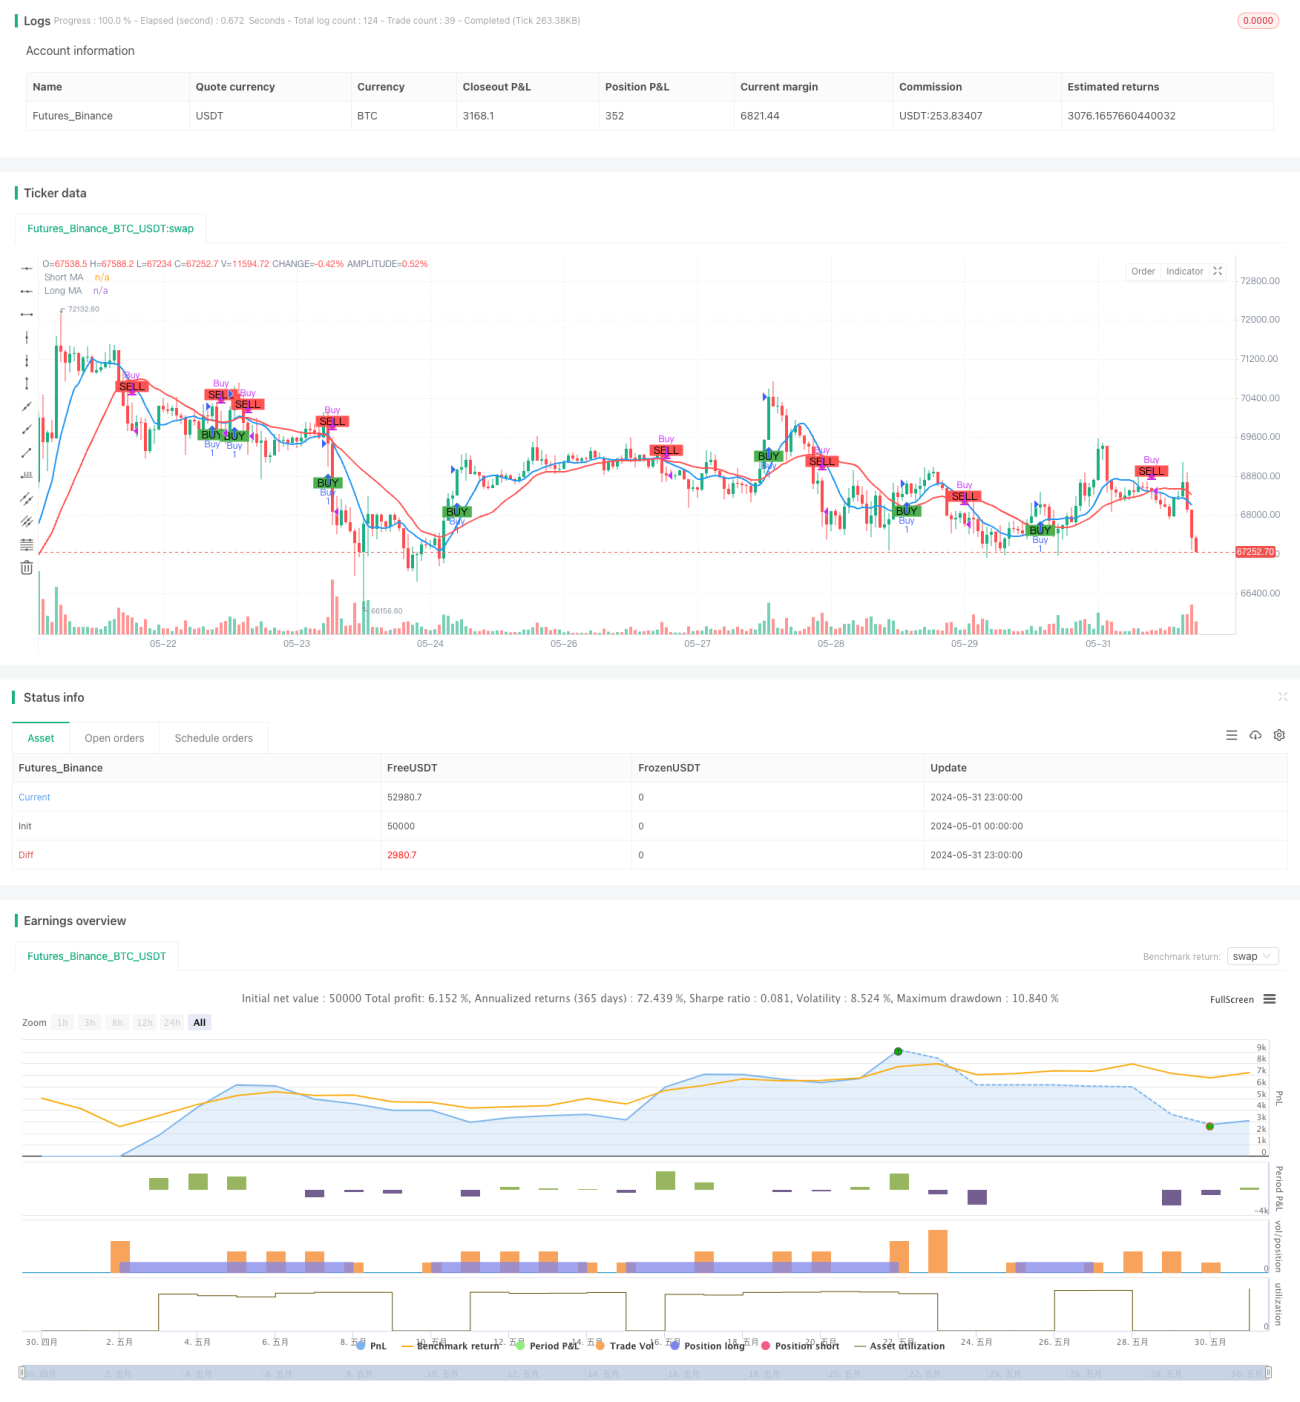
쌍평균선 교차를 기반으로 한 이동 평균 전략은 두 개의 다른 주기의 이동 평균 사이의 관계를 분석하여 시장의 잠재적 인 구매 및 판매 기회를 식별하기위한 간단하고 효과적인 일일 거래 방법입니다. 이 전략은 단기 간단한 이동 평균 (SMA) 과 장기 간단한 이동 평균을 사용하여 단기 평균선 상에서 장기 평균선을 통과하면 인상을 표시하고 잠재적인 구매 기회를 제안합니다. 반대로, 단기 평균선 아래에서 장기 평균선을 통과하면 인상을 표시하고 잠재적인 판매 기회를 제안합니다.
전략 원칙
이 전략의 핵심 원칙은 서로 다른 주기 이동 평균의 트렌드 특성과 지연성을 활용하여 단기 평균과 장기 평균의 상대적 위치 관계를 비교하여 현재 시장의 트렌드 방향을 판단하여 그에 따른 거래 결정을 내리는 것이다. 시장이 상승하는 경향이있을 때, 가격은 먼저 장기 평균을 돌파하고, 단기 평균은 장기 평균을 가로질러 금포를 형성하여 구매 신호를 생성한다. 시장이 하향하는 경향이있을 때, 가격은 먼저 장기 평균을 돌파하고, 단기 평균은 장기 평균을 가로질러 사다포를 형성하여 판매 신호를 생성한다. 이 전략의 파라미터 설정에서 단기 평균은 9번이고, 장기 평균은 21번이며, 두 가지 파라미터는 시장 특성과 개인의 선호에 따라 조정할 수 있다. 이 전략은 또한 초기 자본 관리 개념을 도입하여, 투자 및 거래 비율을 조정하여 각 거래의 포지션 위험을 조정합니다.
전략적 이점
- 단순하고 이해하기 쉬운: 이 전략은 클래식 이동 평균 이론에 기초하고, 논리가 명확하고, 이해하기 쉽고 구현하기 쉽습니다.
- 적응력: 이 전략은 여러 시장과 다른 거래 품종에 적용될 수 있으며, 매개 변수 설정을 조정하여 다양한 시장 특성에 대해 유연하게 대응할 수 있다.
- 트렌드 캡처: 트렌드 방향을 판단하기 위해 쌍평선 교차를 통해 트렌드를 파악하는 것은 거래자가 유행 트렌드를 파악하고 수익을 올릴 수 있도록 도와줍니다.
- 위험 제어: 이 전략은 위험 관리의 개념을 도입하여 포지션 조정으로 각 거래의 위험 <unk>을 제어하고 잠재적인 손실을 효과적으로 관리한다.
- 소음을 줄여: 평행선의 지연성을 활용하여 시장의 무작위적인 소음을 효과적으로 필터링하여 거래 신호의 신뢰성을 향상시킵니다.
전략적 위험
- 매개 변수 선택: 다른 매개 변수 설정은 전략의 성능에 중요한 영향을 미치며, 잘못된 선택은 전략의 실패 또는 좋지 않은 성능을 초래할 수 있다.
- 시장 추세: 위기 시장이나 추세 전환점에서 이 전략이 연속으로 손실이 발생할 수 있습니다.
- 슬라이드 포인트 비용: 자주 거래하는 것은 전략의 전반적인 수익에 영향을 미치는 높은 슬라이드 포인트 비용을 초래할 수 있습니다.
- 블랙 스완 사건: 이 전략은 극단적인 상황들에 대해 잘 적응하지 못하고 있으며, 블랙 스완 사건은 전략에 큰 손실을 초래할 수 있다.
- 과도한 적합성 위험: 역학적 데이터에 너무 많이 의존하는 경우, 전략이 실제 거래에서 좋지 않은 결과를 초래할 수 있습니다.
전략 최적화 방향
- 동적 매개 변수 최적화: 시장 상태의 변화에 따라 전략 매개 변수를 동적으로 조정하여 적응력을 높인다.
- 트렌드 확인: 거래 신호가 생성된 후, 다른 지표 또는 가격 행동 패턴을 도입하여 트렌드를 확인하고 신호의 신뢰성을 향상시킵니다.
- 손실을 막기: 합리적인 손실을 막기 장치를 도입하여 단편 거래의 위험 경계를 더욱 제어합니다.
- 포지션 관리: 포지션 조정을 최적화하는 방법, 예를 들어 변동률 지표를 도입하여 시장의 변동 수준에 따라 포지션을 동적으로 조정한다.
- 다중 공력 평가: 다중 머리 및 공 머리 힘의 대립 관계를 평가하고, 트렌드 초기에 개입하여 트렌드 파악의 정확성을 향상시킨다.
요약하다
쌍평균선 교차를 기반으로 한 이동 평균 전략은 다양한 주기평균선의 위치 관계를 비교하여 시장 추세 방향을 판단하여 거래 신호를 생성하는 간단한 실용적인 일일 거래 방법입니다. 이 전략의 논리는 명확하고 적응력이 강하며 잠재적인 손실을 제어하기 위해 위험 관리 조치를 도입하면서 시장 추세를 효과적으로 포착 할 수 있습니다. 그러나 이 전략에는 변수, 추세 전환, 빈번한 거래와 같은 잠재적인 위험도 있습니다.
Overview
The Moving Average Crossover Strategy based on dual moving averages is a straightforward and effective intraday trading approach designed to identify potential buy and sell opportunities in the market by analyzing the relationship between two moving averages of different periods. This strategy utilizes a short-term simple moving average (SMA) and a long-term simple moving average. When the short-term moving average crosses above the long-term moving average, it indicates a bullish signal, suggesting a potential buying opportunity. Conversely, when the short-term moving average crosses below the long-term moving average, it indicates a bearish signal, suggesting a potential selling opportunity. This crossover method helps traders capture trending moves in the market while minimizing market noise interference.
Strategy Principle
The core principle of this strategy is to utilize the trend characteristics and lag of moving averages with different periods. By comparing the relative position relationship between the short-term moving average and the long-term moving average, it determines the current market trend direction and makes corresponding trading decisions. When an upward trend emerges in the market, the price will first break through the long-term moving average, and the short-term moving average will subsequently cross above the long-term moving average, forming a golden cross and generating a buy signal. When a downward trend emerges in the market, the price will first break below the long-term moving average, and the short-term moving average will subsequently cross below the long-term moving average, forming a death cross and generating a sell signal. In the parameter settings of this strategy, the period of the short-term moving average is set to 9, and the period of the long-term moving average is set to 21. These two parameters can be adjusted based on market characteristics and personal preferences. Additionally, this strategy introduces the concept of money management by setting the initial capital and risk percentage per trade, using position sizing to control the risk exposure of each trade.
Strategy Advantages
- Simplicity: This strategy is based on the classic moving average theory, with clear logic and easy to understand and implement.
- Adaptability: This strategy can be applied to multiple markets and different trading instruments. By adjusting parameter settings, it can flexibly adapt to different market characteristics.
- Trend Capture: By using the dual moving average crossover to determine the trend direction, it helps traders timely follow the mainstream trend and increase profit opportunities.
- Risk Control: This strategy introduces the concept of risk management, using position sizing to control the risk exposure of each trade, effectively managing potential losses.
- Noise Reduction: By utilizing the lag characteristic of moving averages, it effectively filters out random noise in the market, improving the reliability of trading signals.
Strategy Risks
- Parameter Selection: Different parameter settings can have a significant impact on strategy performance. Improper selection may lead to strategy failure or poor performance.
- Market Trend: In ranging markets or trend turning points, this strategy may experience consecutive losses.
- Slippage Costs: Frequent trading may result in higher slippage costs, affecting the overall profitability of the strategy.
- Black Swan Events: This strategy has poor adaptability to extreme market conditions, and black swan events may cause significant losses to the strategy.
- Overfitting Risk: If parameter optimization relies too heavily on historical data, it may lead to poor performance of the strategy in actual trading.
Strategy Optimization Directions
- Dynamic Parameter Optimization: Dynamically adjust strategy parameters based on changes in market conditions to improve adaptability.
- Trend Confirmation: After generating trading signals, introduce other indicators or price behavior patterns to confirm the trend, improving signal reliability.
- Stop-Loss and Take-Profit: Introduce reasonable stop-loss and take-profit mechanisms to further control the risk exposure of each trade.
- Position Management: Optimize the position sizing method, such as introducing volatility indicators to dynamically adjust positions based on market volatility levels.
- Long-Short Strength Assessment: Assess the comparative relationship between bullish and bearish strengths, entering at the early stage of a trend to improve the accuracy of trend capture.
Summary
The Moving Average Crossover Strategy based on dual moving averages is a simple and practical intraday trading method. By comparing the position relationship of moving averages with different periods, it determines the market trend direction and generates trading signals. This strategy has clear logic, strong adaptability, and can effectively capture market trends while introducing risk management measures to control potential losses. However, this strategy also has potential risks such as parameter selection, trend reversal, frequent trading, etc. It needs to be further improved through dynamic optimization, signal confirmation, position management, and other methods to enhance the robustness and profitability of the strategy. In general, as a classic technical analysis indicator, the basic principles and practical application value of moving averages have been widely verified by the market. It is a trading strategy worthy of in-depth research and continuous optimization.
- 1