백분율 임계값 양적 거래 전략

1
Follow
1781
Followers
개요
이 글은 백분율 하락을 기반으로 한 양적 거래 전략을 소개한다. 이 전략은 백분율 하락을 설정하고 적절한 시간 주기를 선택하여 구매와 판매의 시기를 결정한다. 가격이 이전 종결 가격에 비해 상승하거나 감소하면 지정된 백분율 하락을 초과하면 구매 또는 판매 신호를 유발한다. 이 전략은 사용자의 위험 선호와 시장 상황에 따라 유연하게 조정될 수 있으며, 다양한 금융 도구의 거래에 적용된다.
전략 원칙
이 전략의 핵심은 가격의 변화의 비율에 따라 거래 신호를 생성하는 것입니다. 첫째, 사용자는 가격의 이전 종결 가격에 대한 변화의 정도를 나타내는 백분율 적자를 설정해야합니다. 또한 사용자는 1 분, 1 시간, 1 일과 같은 시간 주기도 선택해야합니다. 그 기간의 최고 가격, 최저 가격 및 종결 가격을 계산하기 위해. 전략은 실시간으로 시장 가격을 모니터링하고, 현재 시간 주기 최고 가격이 이전 종결 가격을 초과하면 구매 신호를 유발합니다. 현재 시간 주기 최저 가격이 이전 종결 가격을 초과하면 판매 신호를 유발합니다.
전략적 이점
- 간단하고 사용하기 쉬운: 이 전략은 단지 두 개의 변수, 즉, 퍼센트 절단값과 시간 주기만 설정하면 자동으로 거래 신호를 생성할 수 있으며, 작동이 간단하다.
- 유연성: 사용자는 자신의 위험 선호와 시장 특성에 따라 다른 거래 환경에 맞게 비율 절감과 시간 주기를 조정할 수 있습니다.
- 적용 범위: 이 전략은 주식, 선물, 외환과 같은 다양한 금융 도구에 적용될 수 있으며, 가격 데이터가 있으면 거래가 가능하다.
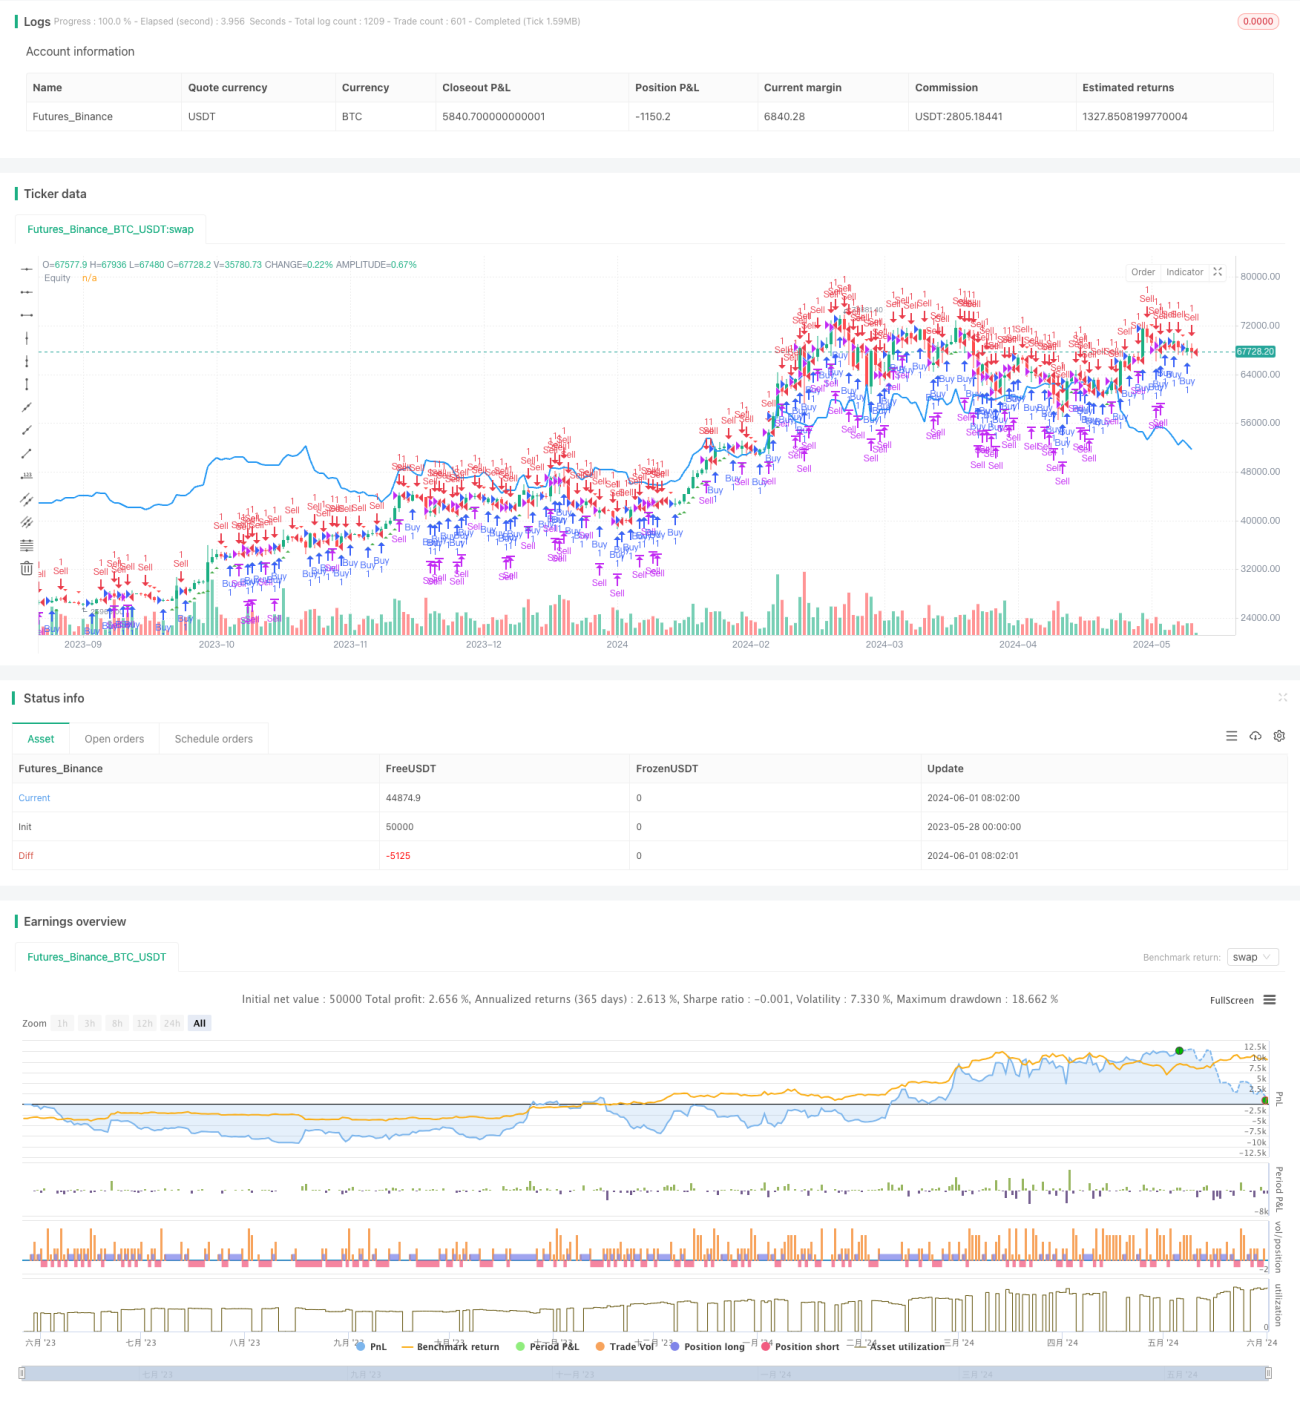
- 직관적으로: 전략은 차트에 직접적으로 구매 및 판매 신호를 표시하고, 투자 곡선을 그리기 때문에 거래자는 전략의 성과를 직관적으로 평가할 수 있습니다.
전략적 위험
- 시장 변동 위험: 시장 가격이 급격히 변동할 때, 자주 거래하는 것은 전략의 수익에 영향을 미치는 높은 거래 비용과 슬라이드 포인트를 초래할 수 있습니다.
- 매개 변수 설정 위험: 부적절한 비율 절댓값과 시간 주기 설정은 전략의 부적절한 성능을 초래할 수 있으므로 시장 특성과 개인 경험에 따라 조정해야 합니다.
- 과도한 적합성 위험: 전략의 매개 변수가 지나치게 최적화되면 전략이 미래의 시장 환경에서 좋지 않은 성과를 낼 수 있으므로 충분한 재검토와 전향적 분석이 필요합니다.
전략 최적화 방향
- 스톱 및 스톱 메커니즘을 추가: 위험을 제어하기 위해 전략에 스톱 및 스톱 기능을 추가 할 수 있으며, 가격이 기본 스톱 또는 스톱 가격에 도달하면 자동으로 지분을 청산하여 자금을 보호 할 수 있습니다.
- 동적 조정 파라미터: 시장의 변동성에 따라, 시장의 다른 상태에 적응하기 위해 비율 절감 및 시간 주기를 동적으로 조정할 수 있습니다. 예를 들어, 시장의 변동이 심해지면 거래 빈도를 줄이기 위해 절감을 적절하게 높일 수 있습니다.
- 다른 기술 지표와 결합: 이 전략을 다른 기술 지표와 결합하여 더 안정적인 거래 시스템을 형성하고 전략의 신뢰성을 향상시킵니다.
요약하다
이 글은 백분율 하락에 기반한 정량 거래 전략으로, 가격 변화의 백분율 하락과 시간 주기 를 설정하여 자동으로 구매 및 판매 신호를 생성한다. 이 전략은 작동이 간단하고, 유연성이 강하며, 적용 범위가 넓지만, 동시에 시장의 변동, 파라미터 설정 및 과다조치 등의 위험에 직면한다. 중지 중지 장치, 동적으로 파라미터를 조정하고 다른 기술 지표와 결합하여 전략의 성능을 더욱 최적화하여 실제 거래에서의 효과를 높일 수 있다.
Source
Pine
Strategy parameters
Related strategies
Comment
All comments (0)
No data
- 1