동적 시간 프레임 고가-저가 돌파 전략

1
Follow
1781
Followers
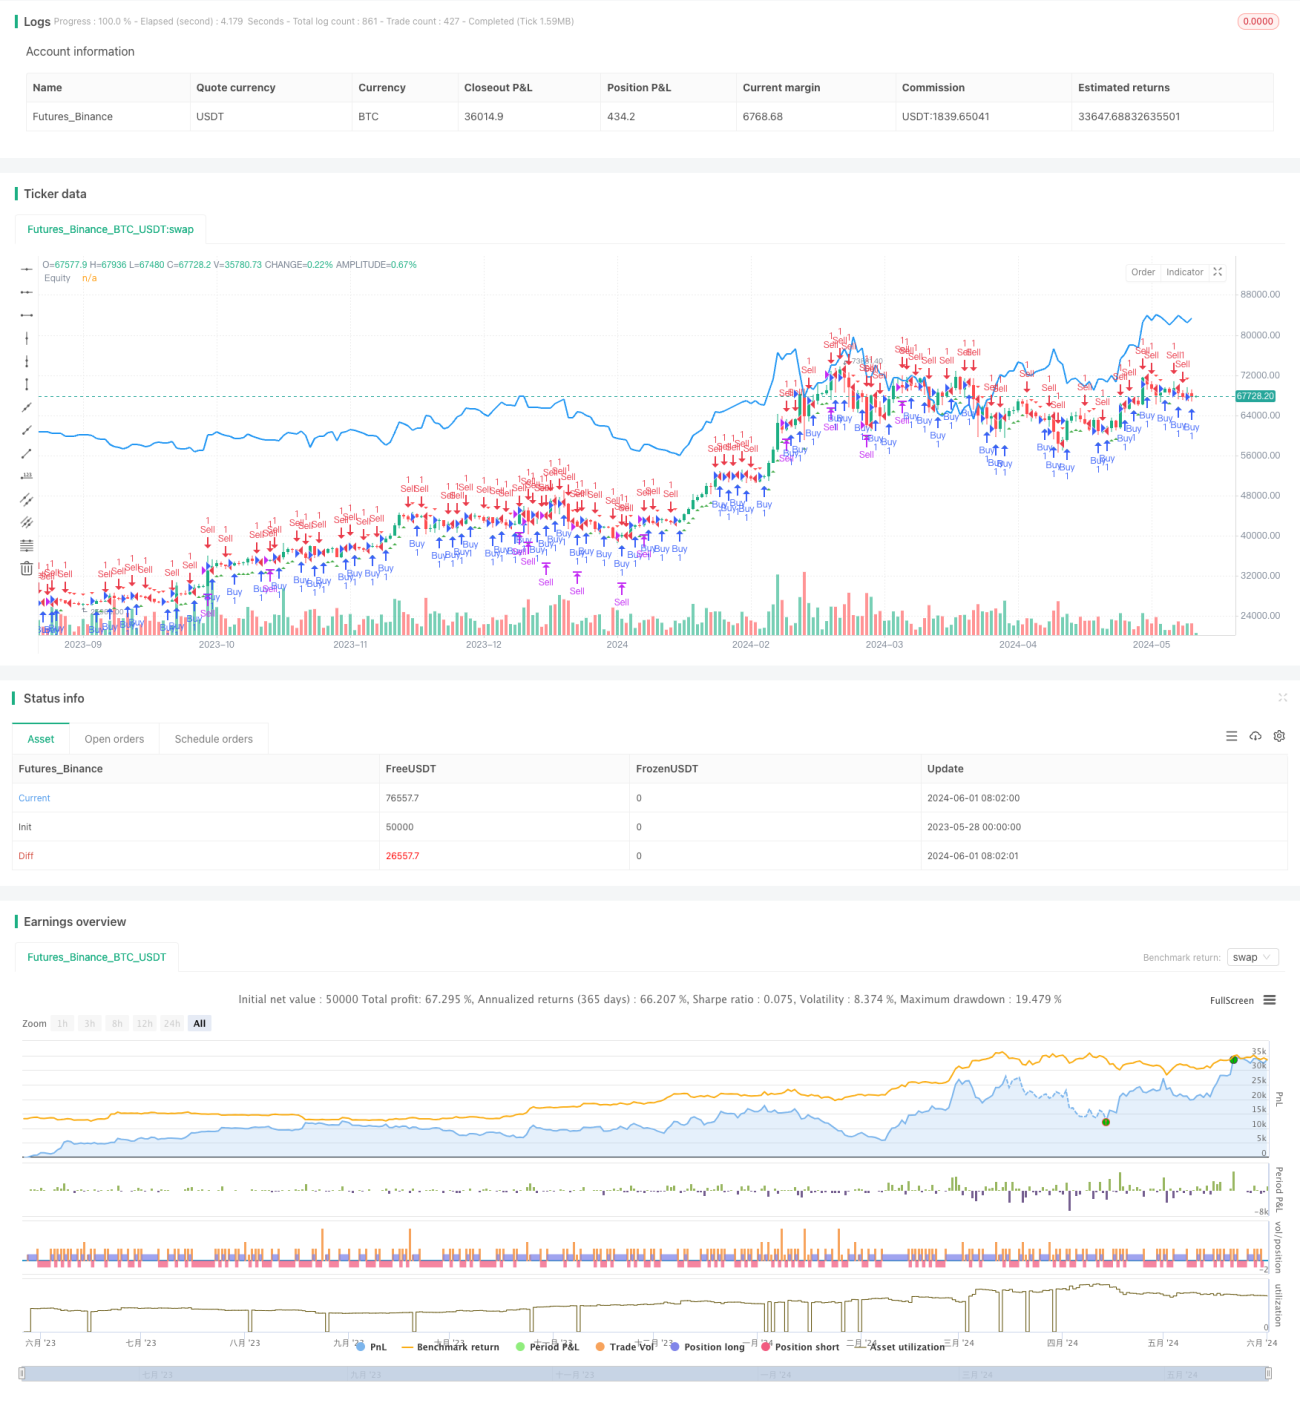
개요
이 전략은 동적 시간 프레임의 높은 낮은 점의 돌파구를 사용하여 거래 신호를 생성한다. 그것은 현재 시간 프레임의 최고 가격과 최저 가격을 이전 시간 프레임의 종결 가격과 더하기 감소한 특정 점으로 비교하여 구매를 결정한다. 이 방법은 다른 시장 움직임과 변동성에 적응할 수 있어 전략의 적응성과 유연성을 높인다.
전략 원칙
이 전략의 핵심은 서로 다른 시간 프레임의 높고 낮은 점을 사용하여 가격 움직임을 판단하는 것이다. 첫째, 사용자가 선택한 시간 프레임에 따라 상응하는 최고 가격, 최저 가격 및 종결 가격 데이터를 얻는다. 다음으로, 현재 시간 프레임의 최고 가격이 이전 시간 프레임의 종결 가격보다 크는지 여부를 비교하여 특정 점수를 더하여 구매 신호를 결정한다. 마찬가지로, 현재 시간 프레임의 최저 가격이 이전 시간 프레임의 종결 가격보다 작는지 여부를 비교하여 특정 점수를 줄여 판매 신호를 결정한다.
전략적 이점
- 적응력: 동적 시간 프레임을 사용하여 전략이 다양한 시장 환경과 변동 특성에 적응하여 전략의 적응력과 안정성을 향상시킬 수 있습니다.
- 간단하고 이해하기 쉽다: 전략 논리는 명확하고 이해하기 쉽고 구현할 수 있으며 복잡한 수학 모델이나 기계 학습 알고리즘이 필요하지 않습니다.
- 높은 유연성: 사용자는 자신의 취향과 경험에 따라 시간 프레임과 점수 마이너스를 조정하여 전략의 성능을 최적화 할 수 있습니다.
- 직관적으로: 차트 상에 거래 신호를 표시하고 이익 곡선을 그리는 것으로, 사용자는 전략의 성과와 위험을 직관적으로 평가할 수 있다.
전략적 위험
- 매개 변수 민감성: 전략의 성능은 시간 프레임과 점수 절댓값과 같은 매개 변수에 민감할 수 있으며, 부적절한 매개 변수 설정으로 인해 전략의 성능이 좋지 않을 수 있다.
- 과도한 적합성 위험: 최적화 매개 변수에서 과도한 적합성이 발생하면 실제 응용에서 전략이 제대로 작동하지 않을 수 있습니다.
- 시장 위험: 전략의 성과는 시장의 갑작스러운 사건, 정책의 변화와 같은 요인에 의해 영향을 받을 수 있으며, 이로 인해 손실이 발생한다.
전략 최적화 방향
- 동적 조정 파라미터: 시장 상황과 전략의 성과에 따라 동적으로 조정되는 시간 프레임 및 점수 절감과 같은 파라미터, 시장 변화에 적응하고 전략의 안정성을 높이기 위해.
- 리스크 관리를 도입: 전략에 스톱 로즈, 포지션 관리와 같은 리스크 제어 조치를 도입하여 단일 거래의 리스크 <unk>을 낮추고 철회 비율을 줄여줍니다.
- 다른 지표와 결합: 이 전략을 다른 기술 지표 또는 기본 요소와 결합하여 보다 안정적이고 포괄적인 거래 시스템을 형성한다.
- 코드 효율성을 최적화: 코드를 최적화하고 개선하여 전략의 실행 효율성과 속도를 높이고 지연 및 슬라이드 포인트 등의 영향을 줄인다.
요약하다
동적 시간 프레임 고저점 돌파 전략은 다양한 시간 프레임의 가격 데이터를 활용하여 고저점 돌파에 따라 거래 신호를 생성한다. 이 전략은 논리적으로 명확하고, 적응력이 강하며, 구현 및 최적화하기 쉽다. 그러나 또한 파라미터 민감성, 과도한 적합성 및 시장 위험과 같은 문제가 있으며 실제 응용에서 지속적인 최적화 및 개선이 필요합니다.
Source
Pine
Strategy parameters
Related strategies
Comment
All comments (0)
No data
- 1