
개요
이 전략은 MACD와 RSI의 두 가지 기술 지표를 결합하여 MACD의 교차 신호와 RSI의 오버 바이 오버 시드를 사용하여 거래 시간을 판단합니다. 동시에, 전략은 전략의 신뢰성을 높이기 위해 중화 이동 평균 ((WMA) 을 보조 판단으로 도입합니다. 전략은 1 시간 시간 프레임에서 작동합니다. MACD의 금색이 나타나고 RSI가 50보다 크면 더 많은 포지션을 열고, MACD의 사각이 나타나고 RSI가 50보다 작으면 더 많은 포지션을 열고, MACD의 사각이 나타나고 RSI가 50보다 작으면 더 많은 포지션을 열고, RSI가 70보다 크면 더 많은 포지션을 열고, RSI가 30보다 적은 포지션을 열고 있습니다.
전략 원칙
이 전략의 핵심은 MACD와 RSI 두 가지 기술 지표의 결합 사용이다. MACD는 빠른 선 ((단기 이동 평균) 과 느린 선 ((장기 이동 평균) 의 차원으로 구성되어 시장의 추세 변화를 반영할 수 있다. 빠른 선에서 느린 선을 통과 할 때, 금 포크가 형성되어 상승 추세를 나타내고, 반대로 죽은 포크가 형성되어 하락 추세를 나타낸다. RSI는 시장의 과매 과매 상태를 측정하는 지표이며, RSI가 70보다 크면 시장이 과매 상태에 있으며 리콜의 위험이 있음을 나타냅니다. RSI가 30보다 작으면 시장이 과매 상태에 있으며 반발 기회를 맞이 할 수 있음을 나타냅니다.
이 전략은 MACD와 RSI를 결합하여 MACD의 트렌드 판단과 RSI의 오버 바이 오버 셀 판단을 사용하여 거래 시기를 더 정확하게 파악할 수 있습니다. 또한, 전략은 중화 이동 평균 ((WMA) 을 보조 판단으로 도입합니다. WMA는 일반 이동 평균에 비해 최근 가격에 더 많은 중점을 두어 가격 변화를 더 민감하게 반영 할 수 있습니다.
또한, 전략은 여러 시간 프레임의 변수를 설정합니다 (예: 15 분, 30 분, 1 시간, 2 시간 등) 서로 다른 시간 스케일의 트렌드 변화를 판단하기 위해. 이러한 여러 시간 프레임의 분석 방법은 전략이 시장 추세를 더 포괄적으로 파악하고 의사 결정의 정확성을 높이는 데 도움이 될 수 있습니다.
우위 분석
- MACD와 RSI가 결합된 두 가지 효과적인 기술 지표로 시장의 추세와 과매매 상태를 더 잘 파악하고 거래 의사 결정의 정확성을 향상시킬 수 있습니다.
- 웨이트 이동 평균 (WMA) 을 도입하여 보조 판단으로 WMA는 최근 가격에 더 많은 관심을 기울이며 가격 변화를 더 민감하게 반영하여 전략의 적응성을 향상시킵니다.
- 여러 시간 프레임의 변수를 설정하고, 여러 시간 프레임의 공동 분석을 구현하여, 시장 추세를 더 포괄적으로 파악하고, 의사 결정의 신뢰성을 향상시킬 수 있습니다.
- 1시간 시간 프레임으로 운영되며 거래 빈도가 적기 때문에 거래 비용과 수익을 더 잘 균형을 잡을 수 있다.
- 명확한 상장 및 상장 조건이 설정되어 있습니다. MACD 금 포크, RSI 과잉 구매 과잉 판매 등이 이해하기 쉽고 실행이 가능합니다.
위험 분석
- MACD와 RSI는 지연된 지표이며, 시장이 급격하게 변할 때 지표 신호가 가격과 분리되어 잘못된 신호가 발생할 수 있습니다.
- 전략은 단일 시간 프레임 ((1시간) 에서 작동하며, 다른 시간 스케일에서의 트렌드 변화를 충분히 포착하지 못할 수 있습니다.
- 전략은 위험에 대한 통제 장치가 부족하여 시장이 급격하게 변동할 때 손실 및 포지션 관리와 같은 큰 철회 위험에 직면 할 수 있습니다.
- 전략의 파라미터 설정 (MACD의 빠른 느린 선주기, RSI의 시간주기 등) 은 서로 다른 시장 상황에 따라 조정될 수 있으며, 파라미터의 선택에는 어느 정도 주관성과 불확실성이 존재한다.
최적화 방향
- 더 많은 기술 지표들, 예를 들어, 브린 띠, ATR 등이 도입되어 보다 안정적인 거래 신호를 구축하고, 전략의 신뢰성을 높일 수 있다.
- 전략을 최적화하기 위한 시간 프레임 선택, 예를 들어, 더 높은 수준의 시간 프레임, 예를 들어, 더 높은 수준의 시간 프레임, 예를 들어, 더 높은 수준의 시간 프레임, 예를 들어, 더 높은 수준의 시간 프레임, 예를 들어, 더 높은 수준의 시간 프레임, 예를 들어, 더 낮은 수준의 시간 프레임, 예를 들어, 15 분, 5 분, 5 분, 5 분, 5 분, 5 분, 5 분, 6 분, 7 분, 7 분, 8 분, 10 분, 10 분, 10 분, 10 분, 10 분, 10 분, 10 분, 10 분, 10 분, 10 분, 10 분, 10 분, 10 분, 10 분, 10 분, 10 분, 10 분, 10 분, 10 분, 10 분, 10 분, 10 분, 10 분, 10 분, 10 분, 10 분, 10 분, 10 분, 10 분, 10 분, 10 분, 10 분, 10 분, 10 분, 10 분, 10 분, 10 분, 10 분, 10 분, 10 분, 10 분, 10 분, 10 분, 10 분, 10 분, 10 분, 10 분, 10 분, 10 분, 10 분
- 리스크 통제 조치를 추가합니다. 예를 들어, 합리적인 스톱 리스를 설정하고, 포지션을 보유하는 것에 제한을 두어, 철수 위험을 제어합니다.
- 전략의 매개 변수를 최적화하기 위해, 기계 학습과 같은 방법을 사용하여, 역사적 데이터에 따라 자동으로 최적의 매개 변수 조합을 찾아 주관적 판단의 영향을 줄일 수 있다.
- 거래량, 지분량 등과 같은 시장 감정과 같은 다른 요소를 도입하는 것을 고려하여 시장 상태를 더 포괄적으로 파악하고 전략의 적응성을 향상시킵니다.
요약하다
이 전략은 MACD와 RSI의 두 가지 유효한 기술 지표를 결합하고 WMA를 보조 판단으로 도입하여 1 시간 시간 프레임 내에서 거래 결정을 내립니다. 전략 논리는 명확하고 이해하기 쉽고 실행할 수 있으며 시장 추세와 과매매 상황을 잘 파악할 수 있습니다. 그러나 전략에는 지연성, 단일 시간 프레임, 위험 제어 부족 등과 같은 제한과 위험이 있습니다.
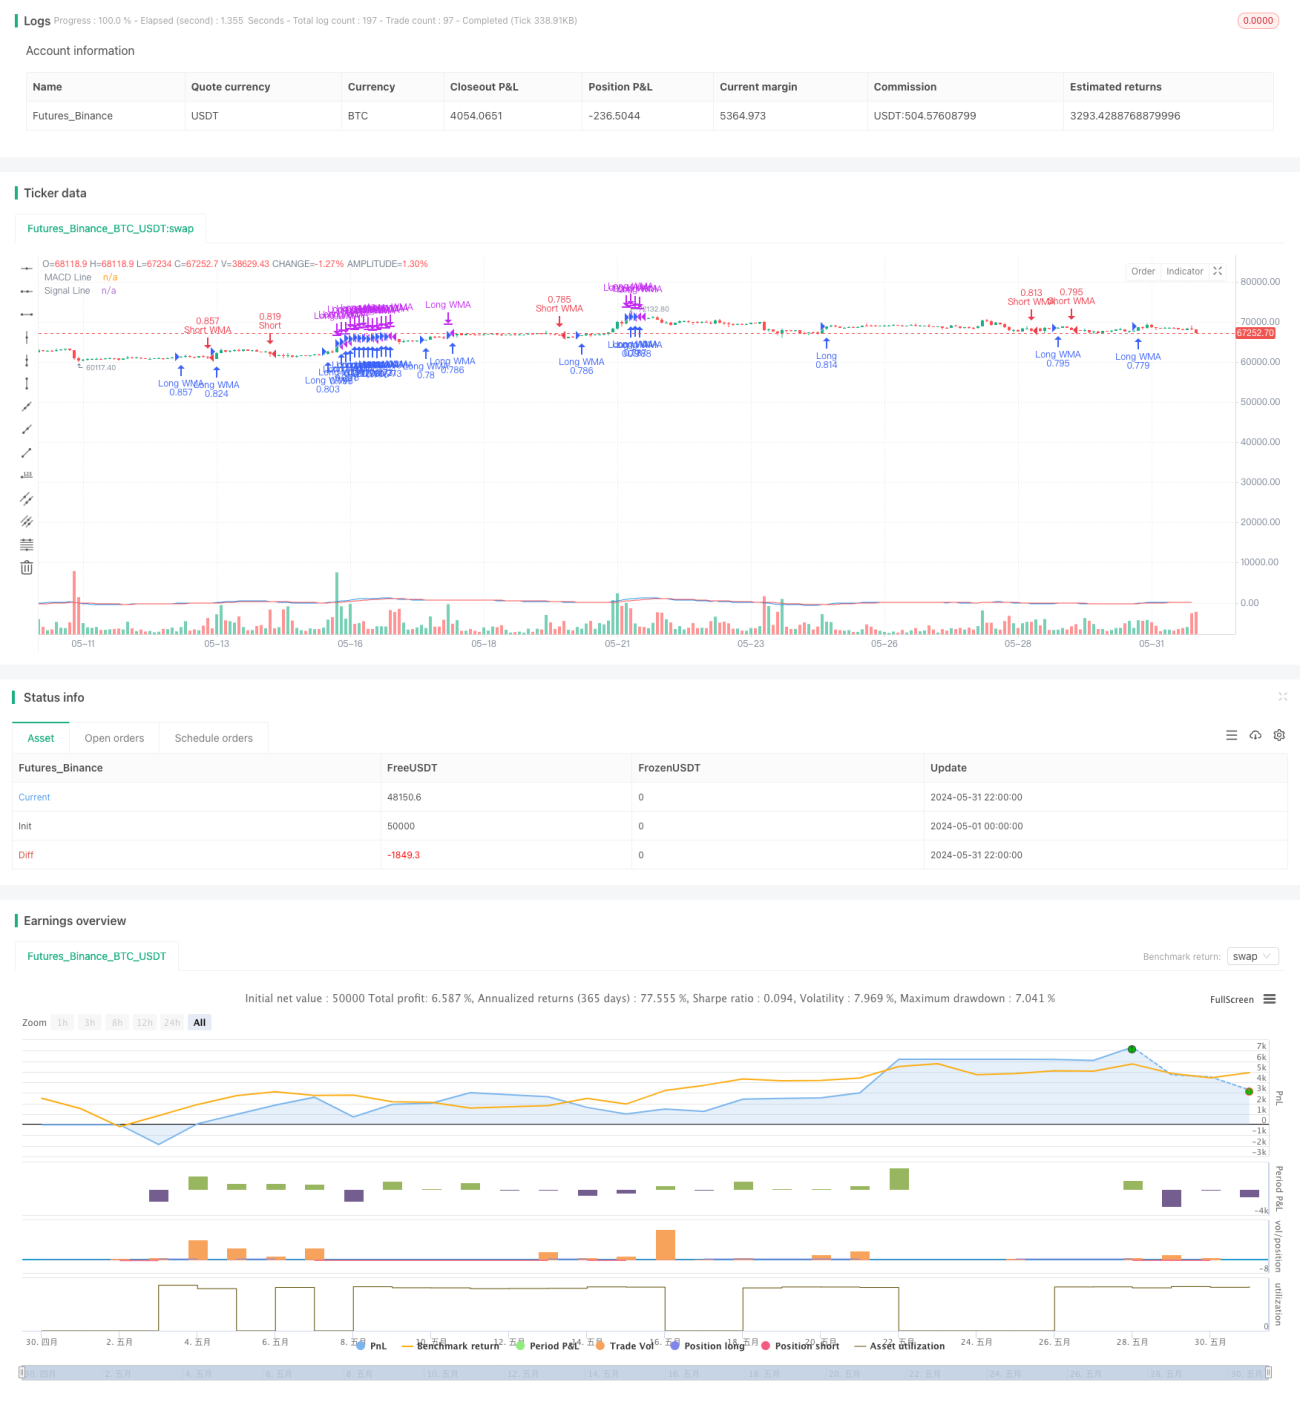
/*backtest
start: 2024-05-01 00:00:00
end: 2024-05-31 23:59:59
period: 2h
basePeriod: 15m
exchanges: [{"eid":"Futures_Binance","currency":"BTC_USDT"}]
*/

//@version=5
strategy("Improved MACD and RSI Trading Strategy", overlay=true, initial_capital=10000, commission_type=strategy.commission.percent, commission_value=0.01, default_qty_type=strategy.percent_of_equity, default_qty_value=100)

// MACD 設置- 1