10SMA와 MACD 듀얼 트렌드 추종 트레이딩 전략

1
Follow
1785
Followers
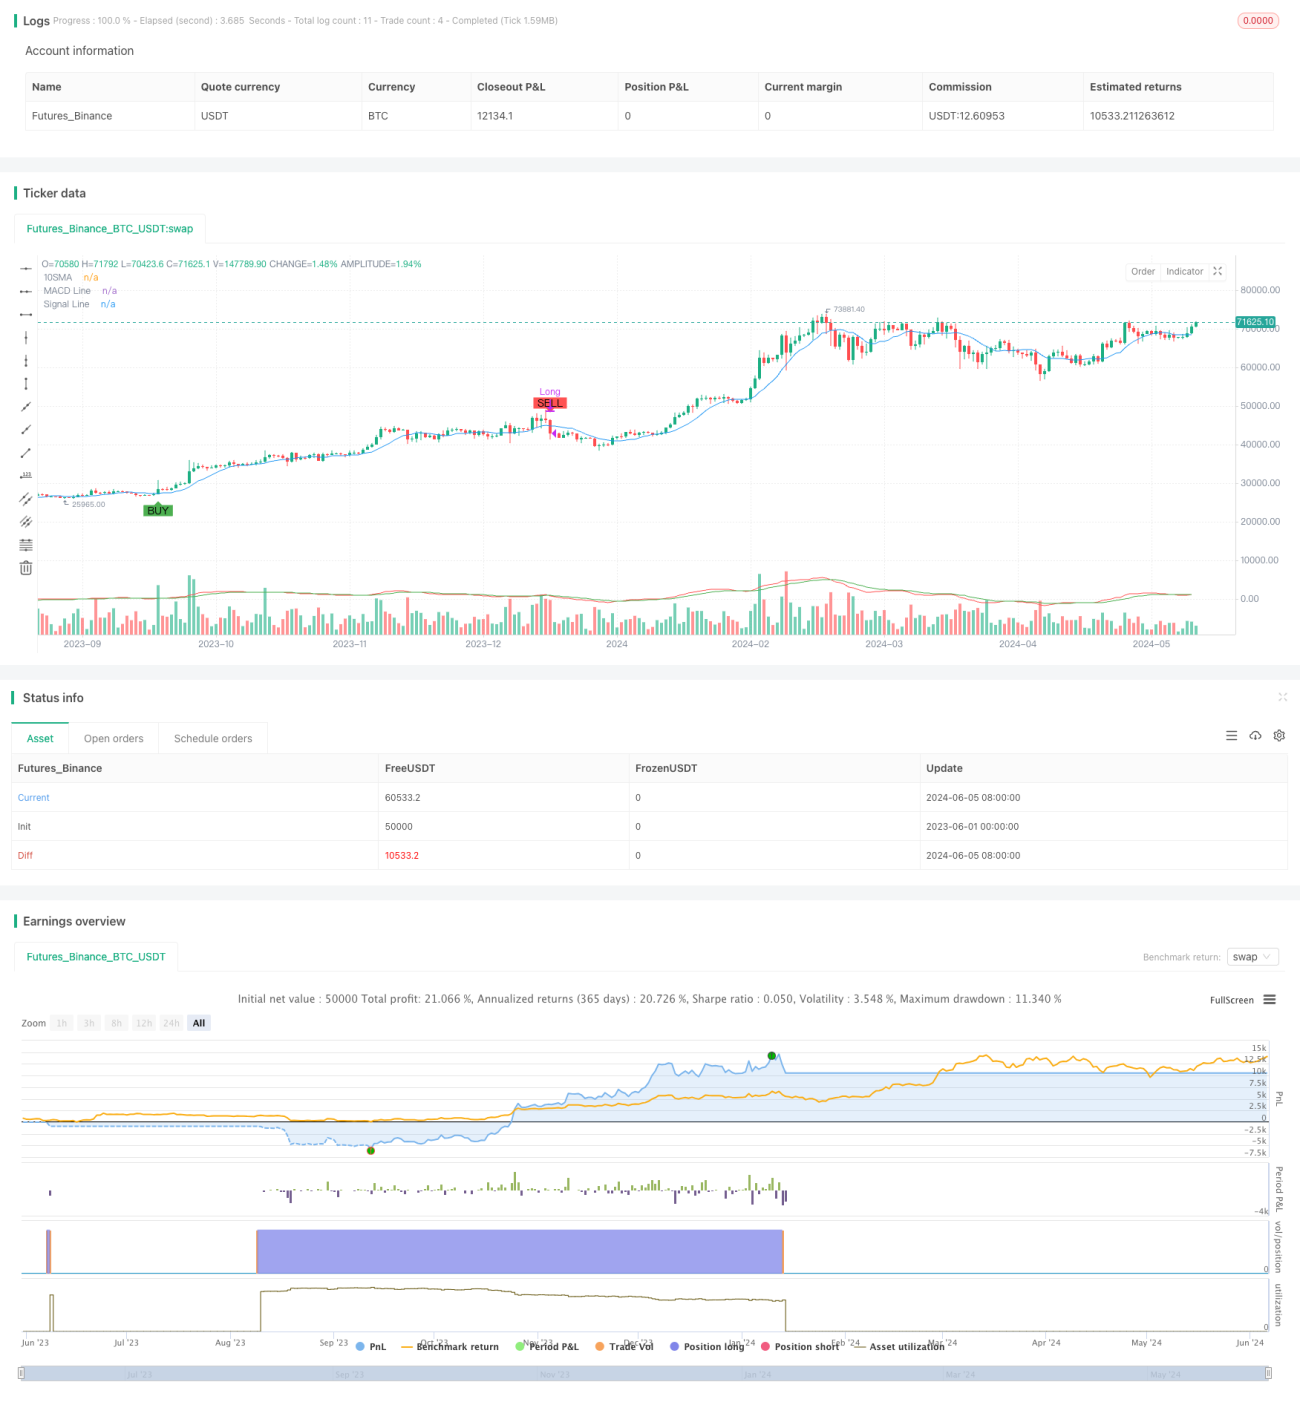
개요
이 전략은 10일 간단한 이동 평균 ((10SMA) 과 이동 평균 수렴 분산 지표 ((MACD) 의 두 가지 기술 지표를 사용하여 가격의 추세 방향을 판단하여 거래 결정을 내립니다. 가격이 10SMA를 통과하고 MACD 단선에서 느린 선을 통과하면 다중 신호가 발생하며, 가격이 10SMA를 통과하고 MACD 단선에서 느린 선을 통과하면 평소 상태가 더 간단합니다. 이 전략은 시장의 추세적 기회를 포착하는 동시에 두 지표의 공동 확인을 통해 신호의 신뢰성을 높입니다.
전략 원칙
- 10일 간단한 이동 평균 ((10SMA) 을 계산하고, 가격 경향을 판단하기 위한 참고 자료로 사용한다. 가격이 10SMA 위를 운행할 때, 다면 추세가 우세하다는 것을 의미하며, 반대로 공면 추세가 우세하다는 것을 의미한다.
- MACD 지표는 단기 및 장기 이동 평균의 차이를 더블 스무팅하여 가격의 경향 강도 및 방향을 반영합니다.
- 트레이딩 신호를 생성합니다.
- 다중 신호: 현재 종결 가격에 10SMA를 통과하고 MACD 빠른 선에 MACD 느린 선을 통과
- 핑토 신호: 현재 폐쇄 가격 아래 10SMA를 통과하고 MACD 빠른 라인 아래 MACD 느린 라인을 통과
- 거래 신호에 따라 거래 실행:
- "다만 신호가 나오면 더 많은 포즈를 취하세요".
- 이 신호가 나오면 모든 포지션을 제거합니다.
이 전략의 핵심은 10SMA의 위치와 가격의 관계를 이용하는 것과 MACD의 빠른 느린 선의 교차를 통해 추세를 판단하는 것입니다. 두 지표의 공동 확인은 신호의 유효성과 신뢰성을 어느 정도 향상시킬 수 있습니다.
우위 분석
- 간단하고 사용하기 쉬운: 이 전략은 두 가지의 일반적인 기술 지표만을 사용하며, 원리는 간단하고, 계산과 적용이 비교적 쉽다.
- 트렌드 추적: 10SMA와 MACD의 조합을 통해 이 전략은 시장의 중·장기적 트렌드를 더 잘 포착하고 추적할 수 있다.
- 필터링 잡음: 가격이나 특정 지표의 신호를 개별적으로 사용하는 것보다 두 지표의 공동 확인은 시장의 잡음과 가짜 신호를 어느 정도 필터링 할 수 있습니다.
- 적응력: 이 전략은 매개 변수 선택에 매우 민감하지 않으며, 적응력이 강하여 다양한 시장과 품종에 적용할 수 있다.
위험 분석
- 지연 위험: 이동 평균과 MACD는 지연 지표이며, 거래 신호는 시장 움직임에 비해 다소 지연 될 수 있으며, 이로 인해 최적의 진입 시간을 놓치거나 수익 공간을 줄일 수 있습니다.
- 오징어 시장 위험: 오징어 시장에서 가격과 지표가 자주 교차하여 거래 신호가 발생하여 과다 거래와 수수료가 증가 할 수 있습니다.
- 갑작스러운 사건의 위험: 이 전략은 주로 기술 지표에 기반하여 거래 신호를 생성하며, 기본 요소와 갑작스러운 사건의 영향을 고려하지 않습니다. 블랙 스<unk> 사건에 직면하여 큰 회전이 발생할 수 있습니다.
- 매개 변수 최적화 위험: 이 전략의 성능은 매개 변수 선택에 의해 영향을 받으며, 다른 매개 변수는 다른 결과를 초래할 수 있으며, 매개 변수 최적화의 위험이 있다.
최적화 방향
- 다른 필터 조건의 추가: 신호의 신뢰성과 효과를 더 높이기 위해 거래량, 변동율 등과 같은 다른 기술 지표 또는 조건을 추가하는 것이 고려 될 수 있습니다.
- 최적화 스톱 스톱: 시장 특성과 개인 위험 선호에 따라 적절한 스톱 스톱 조건을 설정하여 단편 거래의 위험 <unk>홀트 및 수익률을 제어 할 수 있습니다.
- 동적 파라미터 최적화: 파라미터 최적화 방법을 통해, 상이한 시장 상태 및 품종 특성에 따라, 동적으로 시장의 변화에 적응하기 위해 지표 파라미터를 조정할 수 있다.
- 기본적 분석과 결합: 전략의 포괄성과 효과를 높이기 위해 중요한 경제 데이터, 정책 사건과 같은 요소가 시장에 미치는 영향을 고려하여 기술적 분석과 기본적 분석을 결합합니다.
요약하다
10 SMA와 MACD 이중 트렌드 추적 거래 전략은 두 가지 일반적인 기술 지표를 결합하여 시장의 중장기적 트렌드 기회를 간단하고 편리하게 포착합니다. 하나의 지표를 개별적으로 사용하는 것과 비교하여 두 가지 지표의 공동 인지는 신호의 신뢰도와 유효성을 어느 정도 향상시킬 수 있으며 또한 어느 정도의 적응력을 가지고 있습니다. 그러나, 이 전략은 지연, 진동 시장 및 돌발 사건 등의 위험이 있습니다. 실제 응용에서는 시장 특성과 개인 선호에 따라 적절한 최적화 및 개선이 필요합니다.
Source
Pine
Strategy parameters
Related strategies
Comment
All comments (0)
No data
- 1