개요
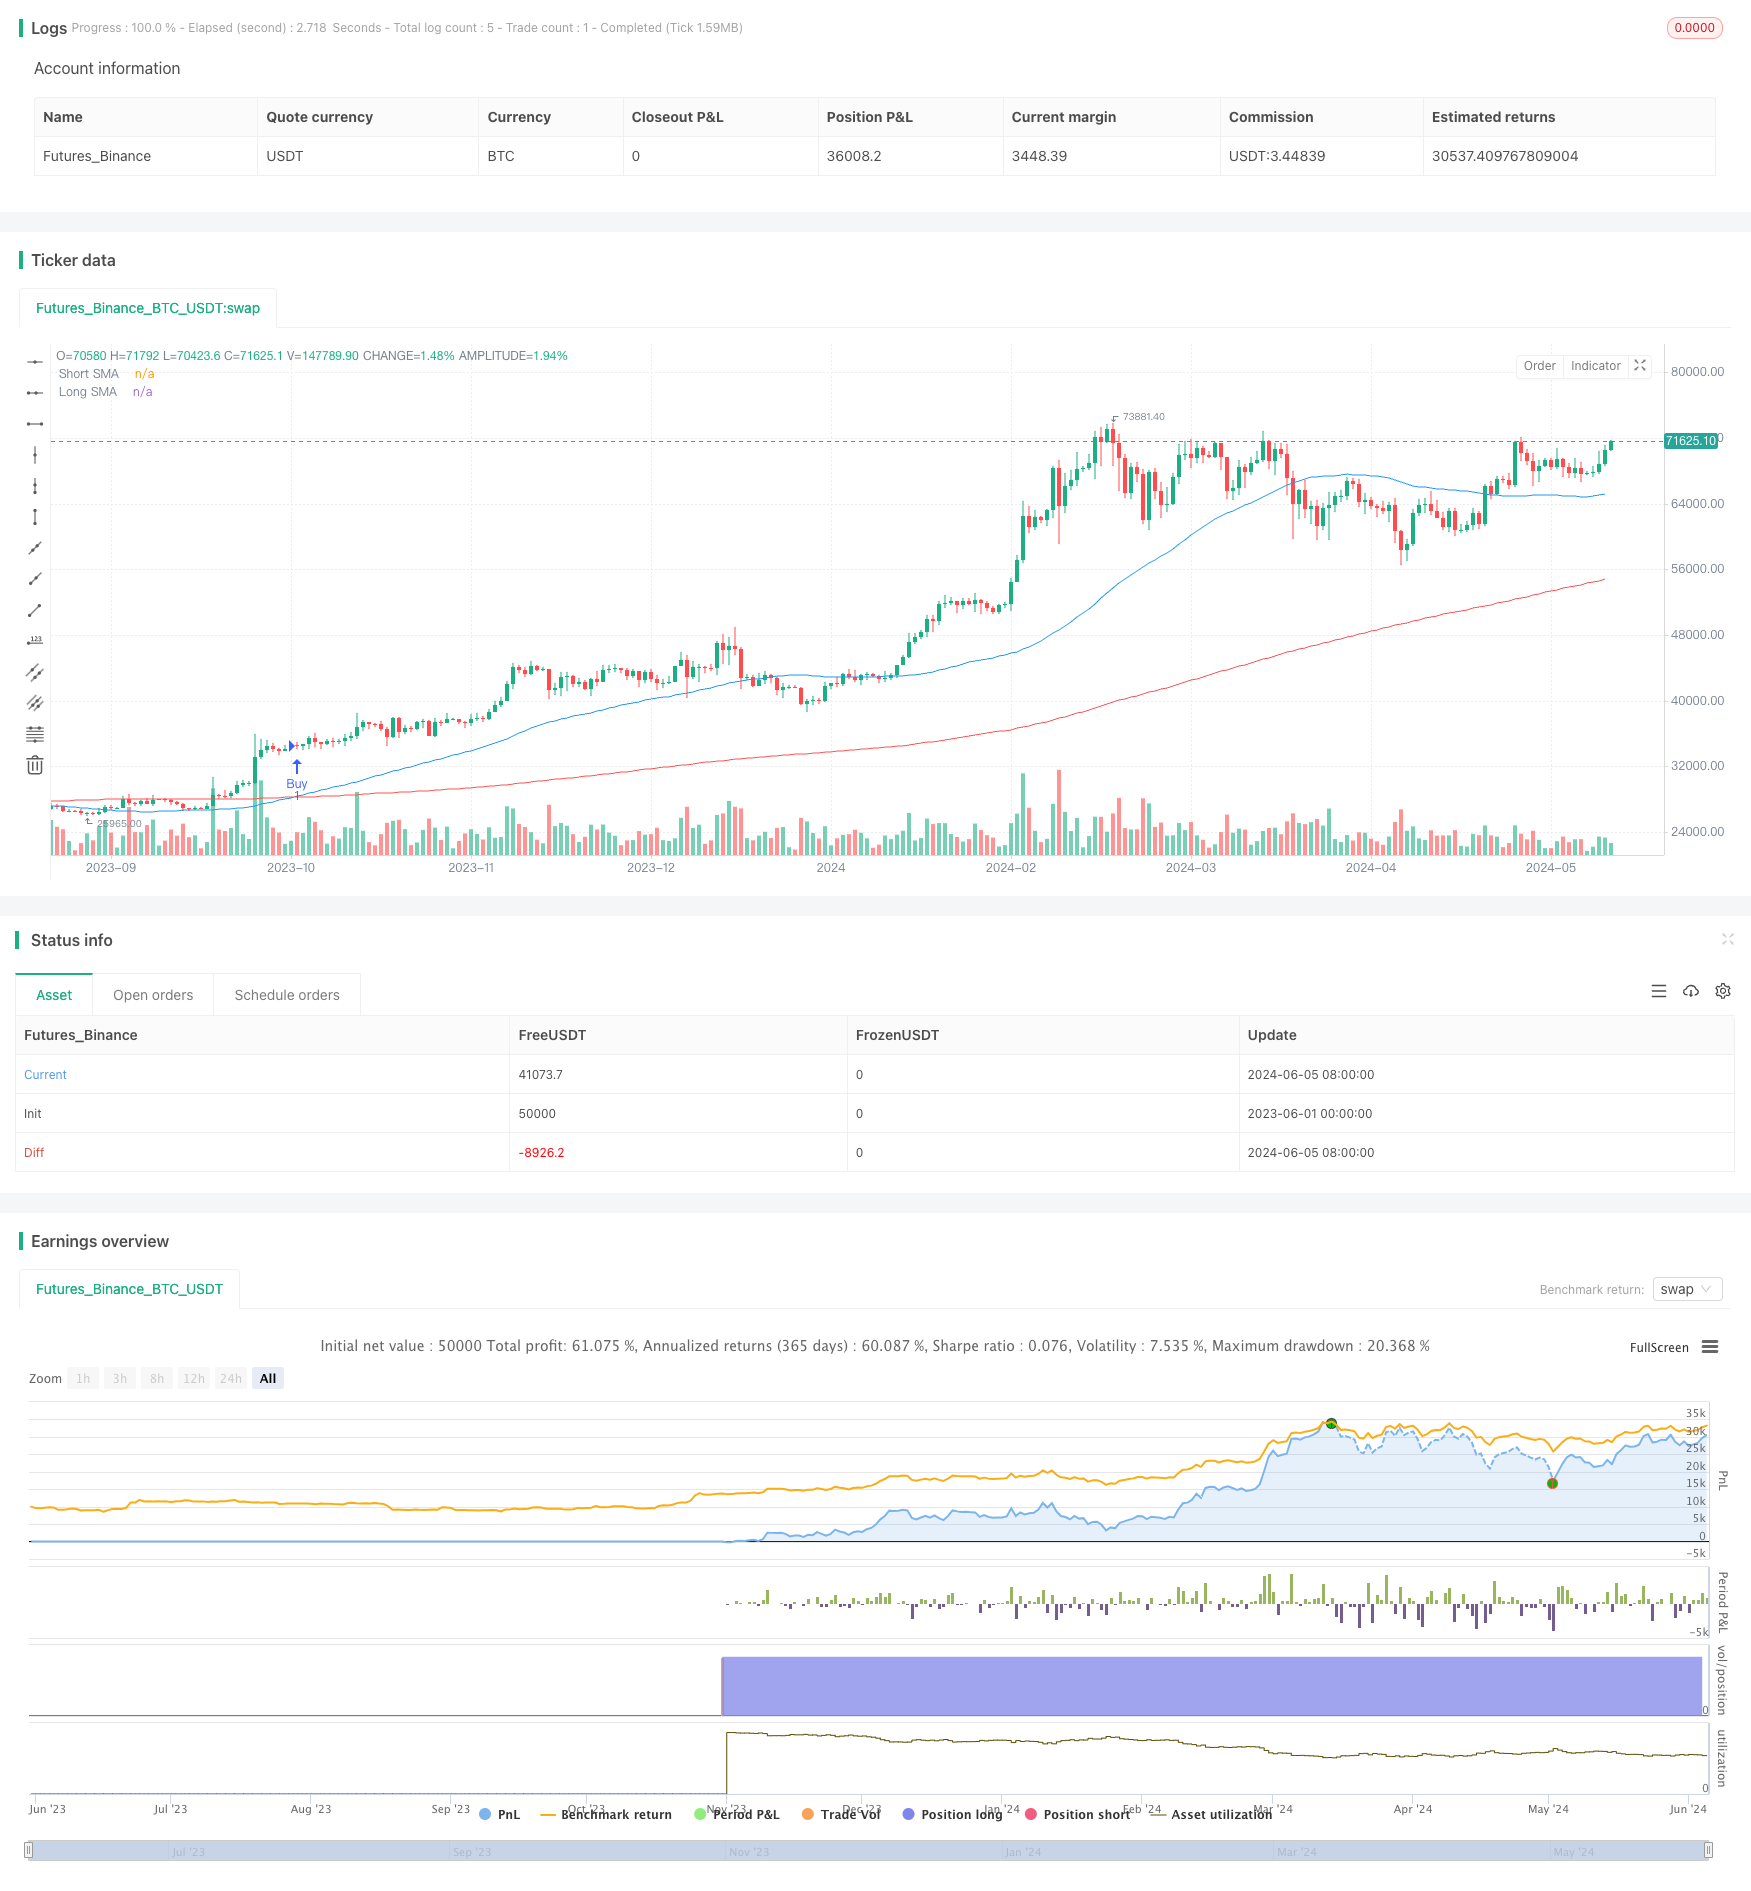
이 전략은 양평선 교차 원칙에 기반한 양적 거래 전략이다. 이 전략은 두 개의 다른 주기에서 간단한 이동 평균을 계산하여 SMA를 계산하여, 단기 SMA 상에서 긴 SMA를 통과하면 구매 신호를 발생시키고, 단기 SMA 아래에서 긴 SMA를 통과하면 판매 신호를 발생시킨다. 이 전략 코드에는 날짜 범위와 시간 프레임의 설정도 도입되어, 전략에 대해 유연하게 재측량 및 최적화를 할 수 있다.
전략 원칙
이 전략의 핵심 원칙은 가격 트렌드의 변화를 포착하기 위해 다른 주기의 이동 평균 사이의 교차 관계를 이용하는 것입니다. 이동 평균은 일반적으로 사용되는 기술 지표이며, 지난 기간 동안의 가격을 평균하여 단기 변동을 제거하여 가격의 전체 트렌드를 반영합니다. 단기 이동 평균 위에 장기 이동 평균을 통과하면 가격이 상승 추세를 시작할 수 있음을 나타냅니다.
전략적 이점
- 간단하고 이해하기 쉬운: 이 전략은 이동 평균의 교차 원칙에 기초하고, 논리가 명확하고, 이해하기 쉽고 구현하기 쉽습니다.
- 적응력: 단기 및 장기 이동 평균의 주기적 변수를 조정하여 다른 시장과 거래 품종에 적응할 수 있다.
- 트렌드 추적: 이동 평균은 가격의 전체적인 트렌드를 효과적으로 포착하여 트렌드가 형성되는 초기 단계에서 거래를 돕습니다.
- 사용자 정의 가능: 이 정책 코드는 날짜 범위와 시간 프레임의 설정을 제공하여 정책을 유연하게 재검토하고 최적화 할 수 있습니다.
전략적 위험
- 변수 민감성: 전략의 성능은 이동 평균의 주기 변수에 민감할 수 있으며, 다른 변수 설정은 다른 결과를 초래할 수 있다.
- 자주 거래: 시장이 큰 변동이나 흔들림 영역에 있을 때, 이 전략은 더 많은 거래 신호를 생성할 수 있으며, 이로 인해 자주 거래와 높은 수수료가 발생한다.
- 지연 효과: 이동 평균에는 약간의 지연성이 있으며, 트렌드가 형성된 후에 거래 신호가 발생하여 최적의 진입 시기를 놓칠 수 있습니다.
- 갑작스러운 사건: 이 전략은 주로 역사적 가격 데이터에 의존하며, 갑작스러운 중대한 사건에 대한 반응이 부족할 수 있다.
전략 최적화 방향
- 다른 기술 지표를 도입: RSI, MACD 등과 같은 다른 기술 지표를 이동 평균과 결합하여 거래 신호의 신뢰성을 향상시킬 수 있습니다.
- 최적화 변수 선택: 단기 및 장기 이동 평균의 주기 변수를 최적화하여 특정 시장 및 거래 품종에 적합한 최적의 변수 조합을 찾습니다.
- 필터링 조건을 추가합니다. 거래량, 변동성 등과 같은 추가 필터링 조건을 도입하여 가짜 신호를 제거합니다.
- 동적 조정 파라미터: 시장 상태의 변화에 따라, 동적으로 이동 평균의 주기적 파라미터를 조정하여 다른 시장 환경에 적응한다.
- 리스크 관리에 참여: 합리적인 스톱 로즈 및 스톱 스톱 규칙을 설정하고, 단일 거래의 리스크 을 제어하고, 전략의 리스크 조정 후 수익을 향상시킵니다.
요약하다
이 SMA 쌍평선 교차 전략은 간단하고 이해하기 쉬운, 적응력이 강한 양적 거래 전략이다. 다양한 주기 이동 평균의 교차 관계를 활용하여 전략은 가격 추세 변화를 효과적으로 포착하여 거래자에게 구매 및 판매 신호를 제공합니다. 그러나 전략의 성능은 파라미터 선택에 민감할 수 있으며, 시장의 변동이 큰 경우 빈번한 거래 및 지연 효과가 발생할 수 있습니다. 전략을 추가적으로 최적화하기 위해 다른 기술 지표의 도입, 최적화 파라미터 선택, 필드 조건의 추가, 동적 조정 파라미터 및 위험 관리 등의 조치를 고려 할 수 있습니다.
전략 소스 코드
/*backtest
start: 2023-06-01 00:00:00
end: 2024-06-06 00:00:00
period: 1d
basePeriod: 1h
exchanges: [{"eid":"Futures_Binance","currency":"BTC_USDT"}]
*/

//@version=5
strategy("SMA Crossover Strategy with Date Range and Timeframe", overlay=true, default_qty_type=strategy.fixed, default_qty_value=1, initial_capital=1000, currency=currency.USD, pyramiding=0, commission_type=strategy.commission.percent, commission_value=0)

// Define the lengths for the short and long SMAs
shortSMA_length = input.int(50, title="Short SMA Length", minval=1)
longSMA_length = input.int(200, title="Long SMA Length", minval=1)

// Define the start and end dates for the backtest
startDate = input(timestamp("2024-06-01 00:00"), title="Start Date")
endDate = input(timestamp("2024-06-05 00:00"), title="End Date")

// Define the timeframe for the SMAs
smaTimeframe = input.timeframe("D", title="SMA Timeframe")

// Request the short and long SMAs from the selected timeframe
dailyShortSMA = request.security(syminfo.tickerid, smaTimeframe, ta.sma(close, shortSMA_length))
dailyLongSMA = request.security(syminfo.tickerid, smaTimeframe, ta.sma(close, longSMA_length))

// Plot the SMAs on the chart
plot(dailyShortSMA, color=color.blue, title="Short SMA")
plot(dailyLongSMA, color=color.red, title="Long SMA")

// Define the crossover conditions based on the selected timeframe SMAs
buyCondition = ta.crossover(dailyShortSMA, dailyLongSMA)
sellCondition = ta.crossunder(dailyShortSMA, dailyLongSMA)

// Generate buy and sell signals only if the current time is within the date range

if (buyCondition)
    strategy.entry("Buy", strategy.long)
if (sellCondition)
    strategy.close("Buy")

// Optional: Add visual buy/sell markers on the chart
plotshape(series=buyCondition and (time >= startDate and time <= endDate), title="Buy Signal", location=location.belowbar, color=color.green, style=shape.labelup, text="BUY")
plotshape(series=sellCondition and (time >= startDate and time <= endDate), title="Sell Signal", location=location.abovebar, color=color.red, style=shape.labeldown, text="SELL")