
1
Follow
1781
Followers
개요
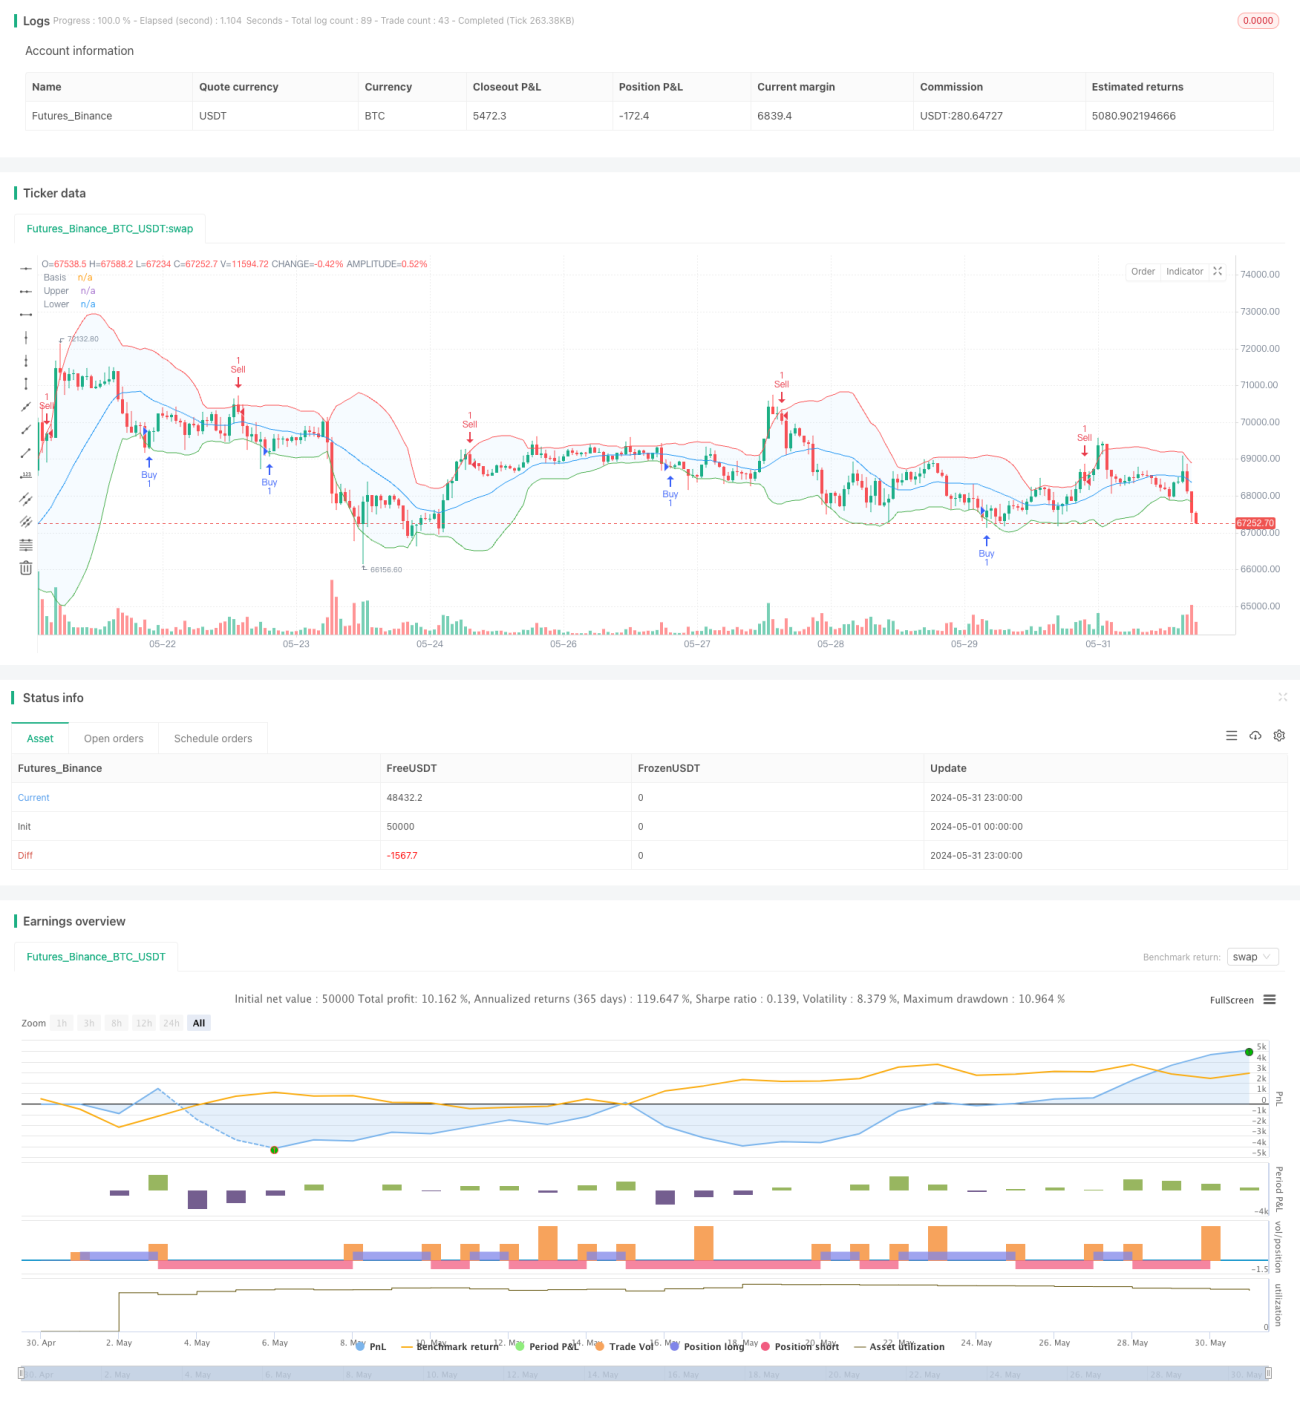
이 전략은 부린 띠와 이동 평균의 두 가지 기술 지표를 결합하여 부린 띠와 가격의 상대적 위치와 빠른 이동 평균의 교차 신호를 통해 시장 추세를 판단하여 선택적 구매를 실현합니다. 가격이 부린 띠를 돌파 할 때 더 많은 포지션을 열고, 경로를 돌파 할 때 더 많은 포지션을 열고, 경로를 돌파 할 때 더 많은 포지션을 열고, 빠른 이동 평균을 돌파 할 때 더 많은 포지션을 열고, 낮은 이동 평균을 돌파합니다. 이 전략은 투자자가 시장 추세를 파악하고, 안정적인 투자 수익을 얻을 수 있도록 도와줍니다.
전략 원칙
- 브린 띠는 3개의 선으로 구성된다: 중도, 상도, 하도. 중도 (중도) 는 이동 평균이며, 상도 (상도) 는 중도 (중도) 를 곱한 값의 표준차를 <unk>다. 가격이 상도를 돌파하면, 시장이 과매 상태임을 나타내고, 회전이 일어날 수 있다. 하도를 돌파하면, 시장이 과매 상태임을 나타내고, 반전이 일어날 수 있다.
- 빠른 이동 평균을 가로지르는 것도 일반적인 추세를 판단하는 방법이다. 빠른 이동 평균 위에 천천히 움직이는 평균을 가로지르는 것은 "골드 포크"라고 불리며, 시장이 강해질 수 있음을 나타냅니다. 빠른 이동 평균 아래에 천천히 움직이는 평균을 가로지르는 것은 "죽은 포크"라고 불리며, 시장이 약해질 수 있음을 나타냅니다.
- 이 전략은 부린띠 판단 과잉 매매를 이용하고, 평평선 교차 판단 경향을 이용합니다. 이 둘을 결합하면 비교적 신뢰할 수 있는 거래 신호를 형성할 수 있습니다. 가격이 부린띠 아래로 내려가며 빠른 평평선에서 느린 평평선을 통과 할 때 더 많이하고, 가격이 부린띠 위로 또는 빠른 평평선 아래로 느린 평평선을 통과 할 때 평점.
우위 분석
- 브린 띠는 가격 변동의 크기에 따라 스스로 적응할 수 있고, 변동률의 변화에 더 민감하다.
- 평행선 시스템은 시장의 흐름을 효과적으로 추적하여 투자자가 주요 트렌드 방향을 파악할 수 있도록 도와줍니다.
- 브린 띠와 평행선을 결합하여 브레이크 + 트렌드 추적 거래 시스템을 형성하여 거래 빈도와 비용을 효과적으로 줄이고 시스템의 안정성을 향상시킬 수 있습니다.
- 코드는 평균선 유형, 주기 등과 같은 여러 파라미터를 설정하여 다른 시장 상황에 맞게 유연하게 조정할 수 있습니다.
위험 분석
- 시장의 변동이 급격히 증가하면 브린 벨트 통로가 급격히 확장되어 더 많은 손실이 발생할 수 있습니다.
- 평균선 시스템은 추세를 판단하는 데 지연이 발생할 수 있으며, 이는 출전 및 출전 시기가 정확하지 않을 수 있다.
- 트렌드형 전략은 불안정한 시장에서 일반적으로 작동하며, 다른 방법과 결합하여 최적화가 필요합니다.
- 변수 설정이 잘못되면 전략이 실패할 수 있으며, 지속적인 조정과 테스트가 필요합니다.
최적화 방향
- 평균선 교차의 기초에 MACD와 같은 다른 트렌드급 지표를 추가하여 트렌드 신호를 더욱 확인 할 수 있다.
- 브린 벨트 브레이크는 ATR과 같은 스톱 손실 지표와 결합하여 회수 위험을 제어 할 수 있습니다.
- 트렌드 판단의 기초에 시세 이탈, 형태 식별 등의 방법을 추가하여 트렌드 전환점을 조기에 판단할 수 있다.
- 다른 스탠더드 및 주기들에 대해, 파라미터를 최적화하여 적절한 파라미터 조합을 찾아내는 것이 필요합니다.
요약하다
부린띠 교차 이동 평균 전략은 부린띠를 통해 과매매를 판단하고, 평평선 교차 판단 경향을 활용하여, 시장 추세를 효과적으로 파악하고, 안정적인 수익을 달성할 수 있는 고전적인 트렌드 추적 전략이다. 그러나 실제 적용에서는 회귀를 제어하고, 파라미터를 최적화하고, 다른 방법과 결합하여 끊임없이 개선하여, 변화하는 시장 환경에 적응하는 것이 필요하다.
Source
Pine
Strategy parameters
Related strategies
Comment
All comments (0)
No data
- 1