RSI 동적 리트레이스먼트 손절매 전략

1
Follow
1781
Followers
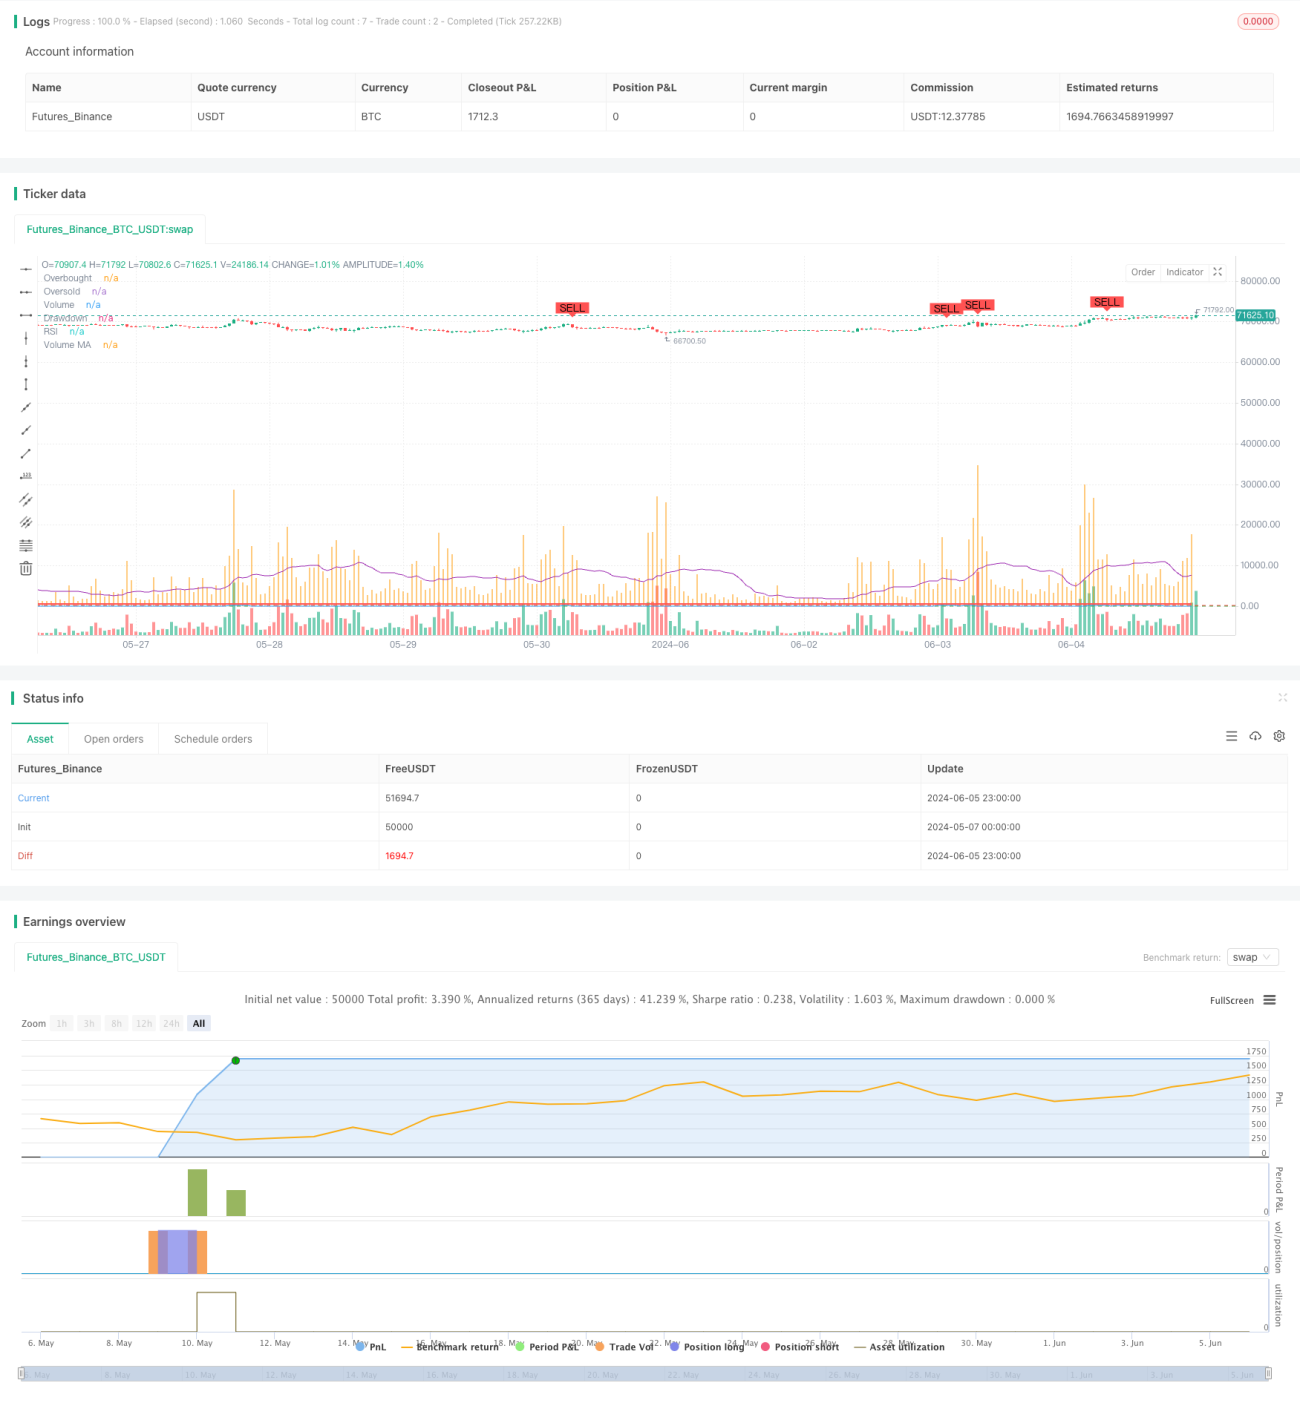
개요
이 전략은 와이코프 방법론에 기초하여, 상대적으로 강한 지수 ((RSI) 와 거래량 이동 평균 ((Volume MA) 과 결합하여 시장의 축적 및 분배 단계를 식별하여 구매 신호를 생성한다. 동시에, 이 전략은 동적 역으로 상환 상환 값을 설정하여 위험을 제어하는 역동적 역으로 상환 상환 장치를 사용합니다.
전략 원칙
- RSI 지표와 거래량 이동 평균을 계산한다.
- RSI가 오버셀드 영역에서 위로 넘어가고 거래량이 거래량 이동 평균보다 크면 시장 축적 단계로 인식되어 구매 신호가 발생합니다.
- RSI가 오버 바이 영역에서 아래로 넘어가고 거래량이 거래량 이동 평균보다 많을 때, 시장 분배 단계로 인식되어 판매 신호를 생성한다.
- 이 전략은 계정의 최대 순액과 현재 인출을 동시에 추적한다. 현재 인출이 설정된 최대 인출 마이너스를 초과하면, 이 전략은 모든 포지션을 청산한다.
- 포지션을 구매할 때 배포 단계에서 또는 최대 인출을 초과할 때 청산하고, 포지션을 판매할 때 축적 단계에서 또는 최대 인출을 초과할 때 청산한다.
전략적 이점
- RSI와 거래량 지표와 결합하여 시장의 축적 및 분배 단계를 더 정확하게 캡처 할 수 있습니다.
- 동적 회수 중지 메커니즘을 사용하여 전략의 최대 회수를 효과적으로 제어하고 전략의 전반적인 위험을 줄일 수 있습니다.
- 5분짜리 높은 주파수 데이터에 적용하여 시장 변화에 신속하게 대응하여 적시에 포지션을 조정할 수 있습니다.
전략적 위험
- RSI와 거래량 지표는 특정 시장 상황에서는 잘못된 거래 결정을 초래하는 잘못된 신호를 일으킬 수 있습니다.
- 최대 회수수준의 설정은 시장 특성과 개인의 위험 선호도에 따라 조정되어야 하며, 부적절한 설정은 전략의 조기 청산이나 과도한 위험을 감수할 수 있다.
- 전략은 불안정한 시장에서 거래 신호를 자주 생성하여 거래 비용을 증가시킬 수 있습니다.
전략 최적화 방향
- 전략의 신호 정확도를 높이기 위해 MACD, 브린 띠 등과 같은 다른 기술 지표를 도입하는 것을 고려할 수 있습니다.
- RSI와 거래량 지표의 매개 변수를 최적화하여 RSI의 길이를 조정하고, 시장의 다른 상황에 맞게 초과 판매 경계를 초과합니다.
- 회수 중지 이외에, 이동 중지 또는 이익 보호 장치가 추가적으로 위험을 제어하고 이익을 잠금 할 수 있습니다.
요약하다
RSI 동적 회수 손해 차단 전략은 RSI와 거래량 지표를 결합하여 시장의 축적 및 배분 단계를 식별하고 동적 회수 손해 차단 장치를 사용하여 위험을 제어합니다. 이 전략은 시장 추세를 파악하는 동시에 위험 관리를 겸비하여 약간의 실용성이 있습니다. 그러나 전략의 성과는 지표 매개 변수 선택과 시장 특성에 달려 있으며 지속적인 최적화 및 조정으로 안정성과 수익성을 높여야합니다.
Source
Pine
Strategy parameters
Related strategies
Comment
All comments (0)
No data
- 1