개요
데-크롤 스톱 다이내믹 ATR 트렌드 추적 전략은 데-크롤 스톱 지표와 간단한 이동 평균 (SMA) 을 기반으로 한 정량화 거래 전략이다. 이 전략은 시장의 상승 추세를 포착하면서 동적 스톱을 사용하여 위험을 관리한다. 데-크롤 스톱 지표는 평균 실제 파도 (ATR) 에 따라 동적으로 스톱 레벨을 조정하여 다양한 시장 변동 상황에 맞게 조정한다.
전략 원칙
이 전략의 핵심은 Chande-Kroll Stop loss indicator로, ATR을 사용하여 동적 중지 수준을 계산한다. ATR은 시장의 변동성을 측정하며, 중지 수준은 ATR과 곱하기 동적 변화에 따라 조정된다. 더하기 조건: 종전 가격이 Chande-Kroll 하향 궤도를 돌파하고 21주기 SMA보다 높을 때 더하기 시작하십시오. 평점 조건: 종점 가격이 Chande-Kroll 상반도를 넘어갈 때 평점.
전략적 이점
- 역동적 스톱: Chande-Kroll 스톱 지표는 ATR 계산에 기초한 역동적 스톱 레벨을 기반으로 다양한 시장 변동 상황에 적응하여 스톱의 효과를 높인다.
- 트렌드 추적: 21주기 SMA는 트렌드 필터로서 거래가 주요 트렌드 방향에 부합하는지 확인하고 역동 거래의 위험을 줄입니다.
- 매개 변수 유연성: 전략 매개 변수인 ATR 주기, ATR 곱하기, 중지 주기, SMA 주기 등은 사용자의 선호도에 따라 조정될 수 있으며, 전략의 적응성을 향상시킨다.
- 포지션 규모 관리: 포지션 규모는 위험 배수 및 현재 시장 변동 상황에 따라 동적으로 조정되어 위험을 동적으로 관리합니다.
전략적 위험
- 매개 변수 최적화 위험: 전략 매개 변수는 다른 시장 상황과 거래 품종에 따라 최적화되어야 하며, 부적절한 매개 변수 설정은 전략의 부적절한 성능을 초래할 수 있다.
- 트렌드 인식 위험: 위기 시장이나 트렌드 반전의 초기에는 전략이 잘못된 신호를 만들어 손실을 초래할 수 있다.
- 슬라이드 포인트 및 거래 비용: 실제 거래에서 슬라이드 포인트 및 거래 비용은 전략의 순 수익에 영향을 미칩니다. 위험 관리 조치에는 다음과 같은 것들이 포함됩니다. 전략에 대한 전체적인 피드백과 매개 변수 최적화; 실제 거래에서 전략 규칙을 엄격하게 따르고 각 거래의 위험을 제어하십시오. 전략의 성능을 정기적으로 평가하고 필요한 경우 조정하십시오.
전략 최적화 방향
- 다중공간 쌍방향 거래: 현재 전략은 단지 다중 신호를 하는 것뿐이며, 다중공간 쌍방향 거래로 확장하여 다양한 시장 환경의 기회를 충분히 포착할 수 있다.
- 동적 변수 최적화: 기계 학습 또는 최적화 알고리즘을 사용하여 시장 상황에 따라 전략 변수를 실시간으로 조정하여 적응력을 향상시킵니다.
- 다른 기술 지표의 조합: 다른 트렌드 클래스 또는 흔들림 클래스 지표를 도입, 다중 요소 전략을 구축, 신호의 신뢰성을 향상.
- 시장 감정 지표에 가입: 시장 감정 지표 (VIX) 와 같은 시장 감정 지표와 결합하여, 시장 감정이 극단적일 때 거래를 제어하고, 위험 관리 능력을 향상시킨다.
요약하다
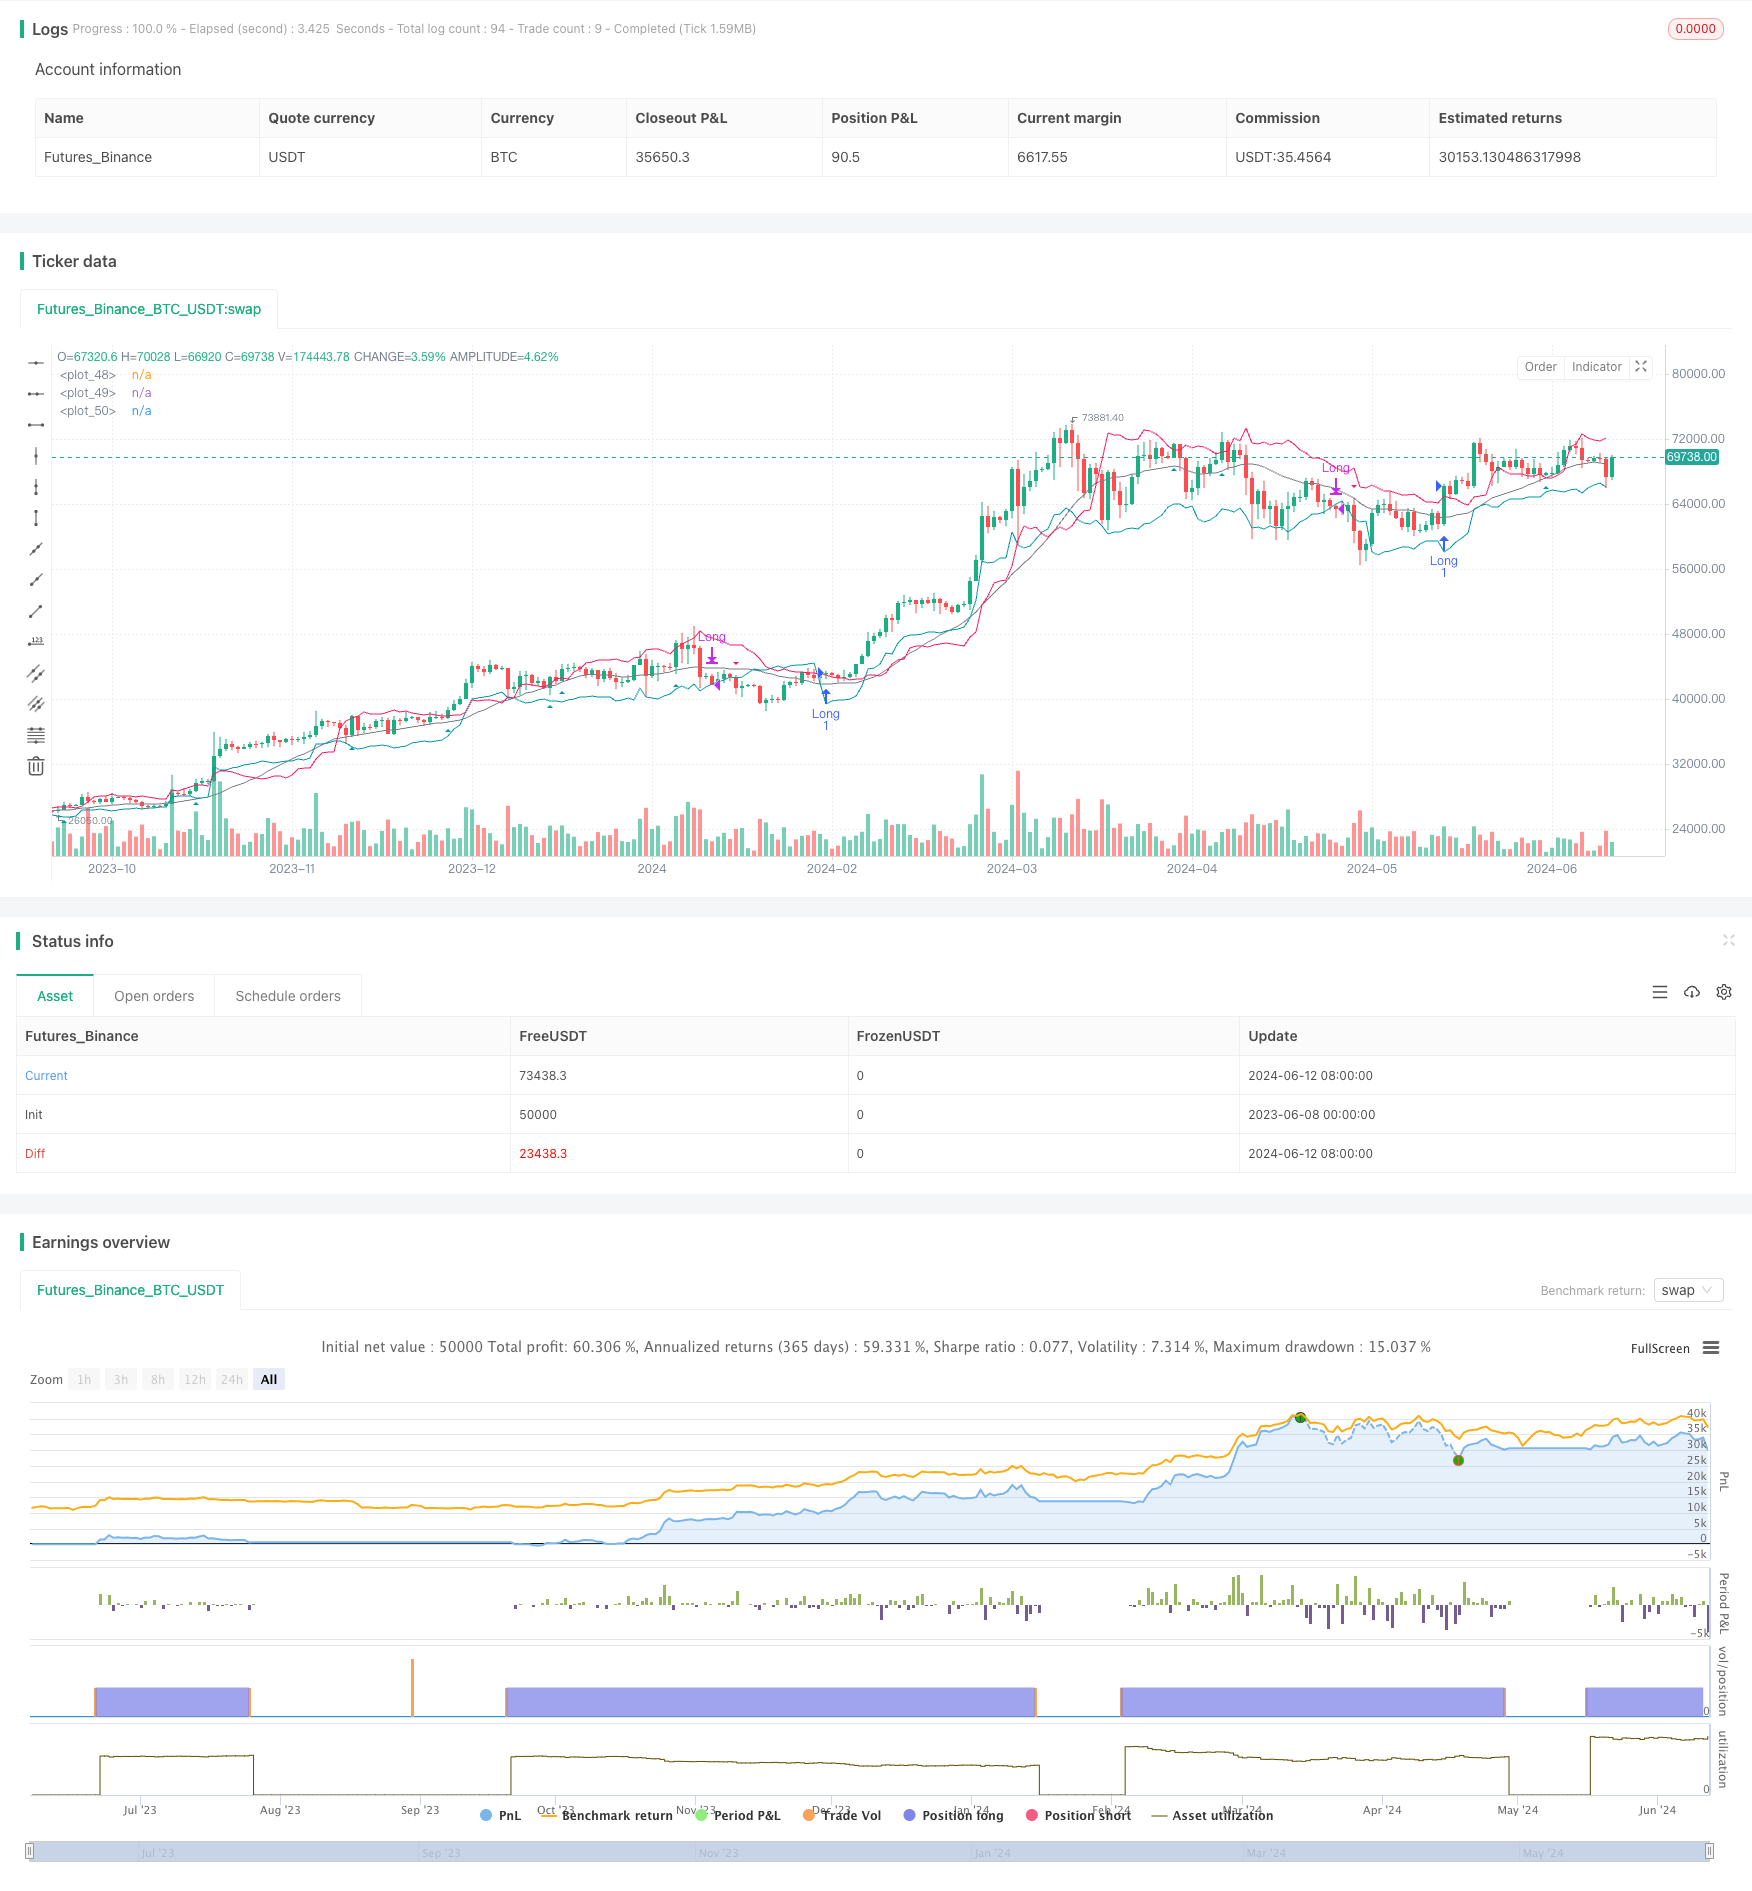
데-크롤 정지 동적 ATR 트렌드 추적 전략은 동적 정지 및 트렌드 추적 원칙에 기반한 양적 거래 전략이다. 데-크롤 정지 지표와 SMA 트렌드 필터를 결합하여 전략은 상승 추세를 포착하면서 위험을 효과적으로 관리할 수 있다. 전략의 매개 변수의 유연성과 포지션 규모의 동적 조정으로 전략의 적응성을 더욱 강화한다. 전략에는 약간의 위험이 있음에도 불구하고 합리적인 위험 관리 조치와 지속적인 최적화 개선으로 전략은 장기적으로 안정적인 수익을 얻을 수 있다.
전략 소스 코드
/*backtest
start: 2023-06-08 00:00:00
end: 2024-06-13 00:00:00
period: 1d
basePeriod: 1h
exchanges: [{"eid":"Futures_Binance","currency":"BTC_USDT"}]
*/

//@version=5
strategy("Chande Kroll Stop Strategy", overlay=true, initial_capital = 1000, commission_type = strategy.commission.percent, commission_value = 0.01, slippage = 3)

// Chande Kroll Stop parameters
calcMode = input.string(title="Calculation Mode", defval="Exponential", options=["Linear", "Exponential"])
riskMultiplier = input(5, "Risk Multiplier")
atrPeriod = input(10, "ATR Period")
atrMultiplier = input(3, "ATR Multiplier")
stopLength = input(21, "Stop Length")
smaLength = input(21, "SMA Length")

// Calculate ATR
atr = ta.atr(atrPeriod)

// Calculate Chande Kroll Stop
highStop = ta.highest(high, stopLength) - atrMultiplier * atr
lowStop = ta.lowest(low, stopLength) + atrMultiplier * atr

sma21 = ta.sma(close, smaLength)

// Entry and Exit conditions
longCondition = ta.crossover(close, lowStop) and close > sma21
exitLongCondition = close < highStop

// Funktion zur Berechnung der Menge
calc_qty(mode, riskMultiplier) =>
    lowestClose = ta.lowest(close, 1560)
    if mode == "Exponential"
        qty = riskMultiplier / lowestClose * 1000 * strategy.equity / strategy.initial_capital
    else
        qty = riskMultiplier / lowestClose * 1000

// Berechnung der Menge basierend auf der Benutzerwahl
qty = calc_qty(calcMode, riskMultiplier)

// Execute strategy
if (longCondition)
    strategy.entry("Long", strategy.long, qty=qty)
    alert("Buy Signal", alert.freq_once_per_bar_close)

if (exitLongCondition)
    strategy.close("Long")
    alert("Sell Signal", alert.freq_once_per_bar_close)

// Plotting
plotshape(series=longCondition, location=location.belowbar, color=#0097a7, style=shape.triangleup, size=size.small, title="Buy Signal")
plotshape(series=ta.crossunder(close, highStop), location=location.abovebar, color=#ff195f, style=shape.triangledown, size=size.small, title="Sell Signal")
plot(sma21, color=color.gray)
plot(highStop, color=#0097a7)
plot(lowStop, color=#ff195f)