
1
Follow
1780
Followers
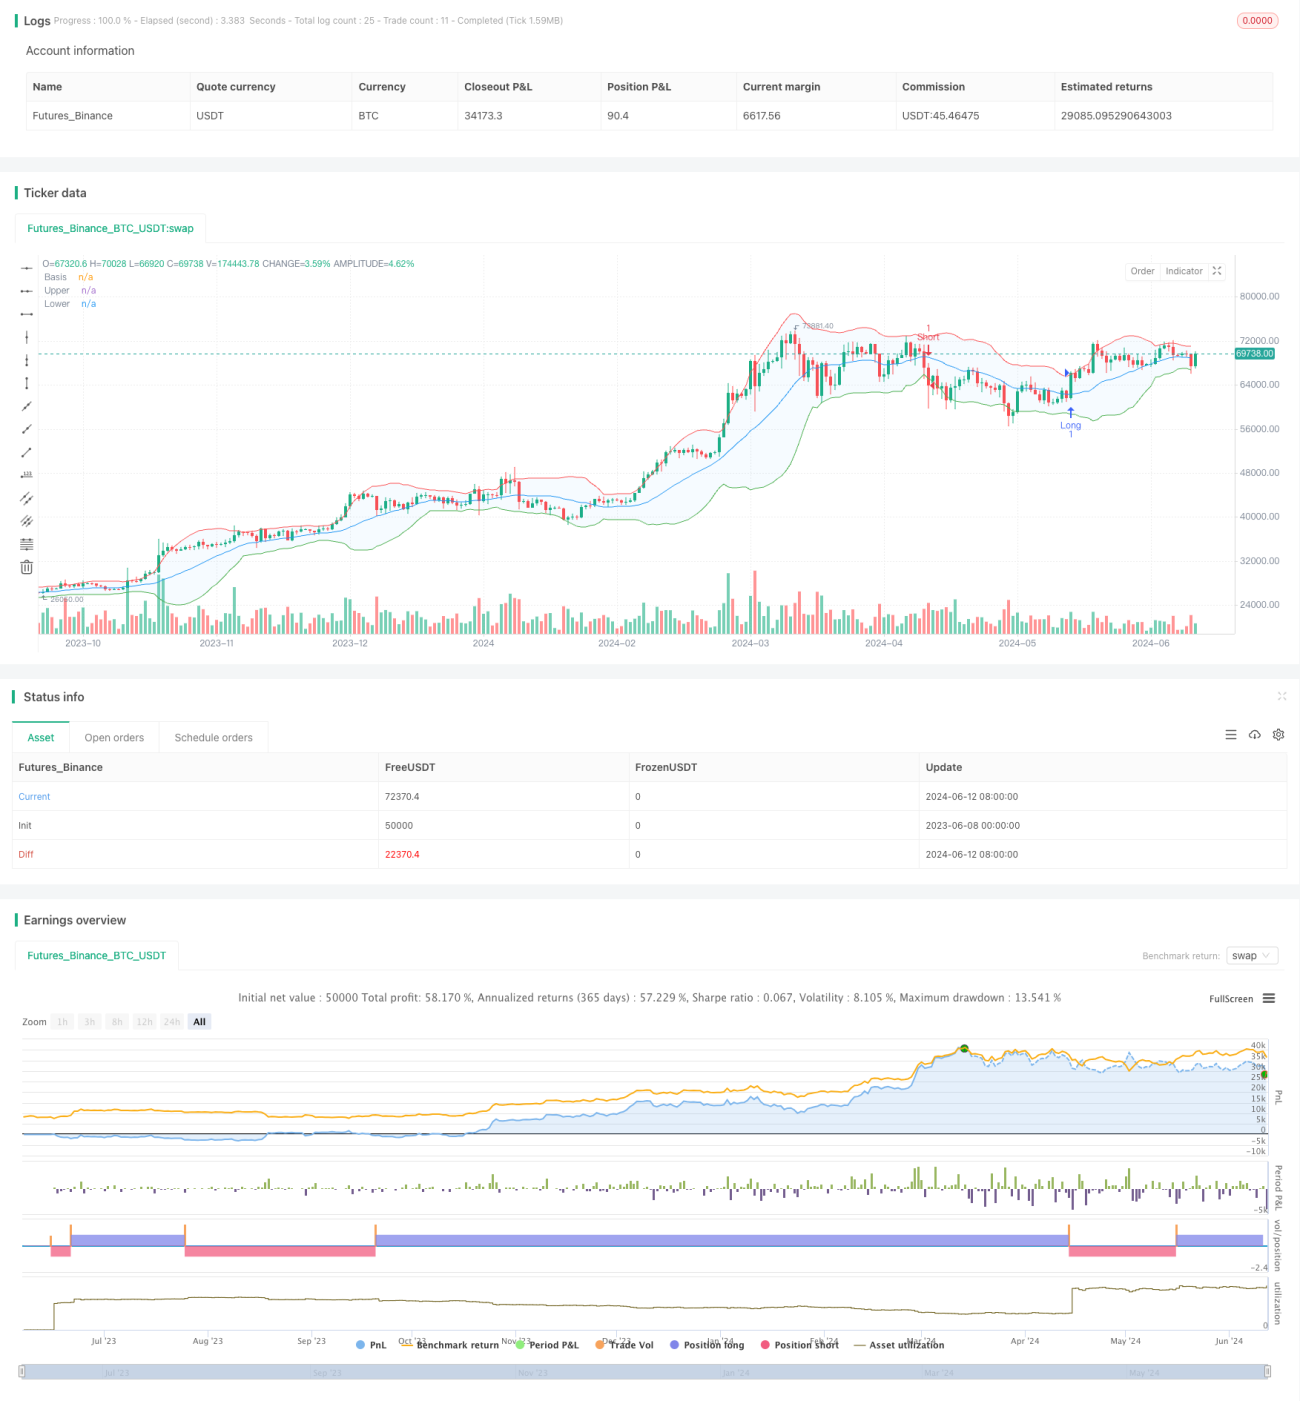
개요
이 전략은 부린 밴드 (Bollinger Bands) 지표에 기초하여, 가격이 부린 밴드를 뚫고 하향으로 가는 방식으로 거래 신호를 생성한다. 가격이 상향으로 갈 때 더하고, 하향으로 갈 때 공백한다. 동시에, 가격이 하향으로 갈 때 더 많이 들고, 가격이 하향으로 갈 때 더 평평하다.
전략 원칙
- 지정된 주기의 이동 평균을 브린 밴드의 중간 궤도로 계산하고, SMA, EMA, SMMA, WMA 및 VWMA와 같은 다른 유형의 이동 평균을 선택할 수 있다.
- 중궤도 덧셈의 일정한 배수의 표준차를 브린띠의 상하궤도로 계산한다.
- 가격 돌파가 상회할 때 다중 신호를 생성하고, 하위 돌파가 하위 돌파가 하위 신호를 생성한다.
- 더 많은 지명을 보유하면 가격이 하락했을 때 평점; 공명 지명을 보유하면 가격이 상승했을 때 평점.
우위 분석
- 브린 띠는 시장의 변동성을 잘 측정하고 가격 변동이 심해지면 명확한 거래 신호를 제공합니다.
- 전략은 동시에 스톱로스 조건을 설정하여 위험을 효과적으로 제어할 수 있다.
- 전략의 매개 변수는 조정 가능하며, 다양한 품종과 주기에 따라 최적화될 수 있으며, 어느 정도 적응성과 유연성을 갖는다.
위험 분석
- 불안정한 시장에서, 가격이 자주 브린을 뚫고 하락하는 것은 거래 신호가 너무 자주 발생하여 거래 비용을 증가시킬 수 있습니다.
- 브린은 시장이 급격히 변화할 때 거래 신호가 지연될 수 있는 지연성을 가지고 있다.
- 부린 밴드 파라미터를 잘못 선택하면 전략이 좋지 않을 수 있으며, 다양한 품종과 주기에 따라 최적화가 필요합니다.
최적화 방향
- 트렌드 지표 또는 가격 행동 패턴 식별과 같은 방법을 도입하여 거래 신호를 2차 확인하여 가짜 브레이크로 인한 손실 거래를 줄이는 것을 고려할 수 있습니다.
- ATR과 같은 지표에 따라 동적 중지 설정이나 추적 중지와 같은 방법을 도입하여 위험을 더 제어하는 등 손실 조건을 최적화 할 수 있습니다.
- 유전 알고리즘, 격자 검색 등의 방법을 통해 전략 매개 변수를 최적화하여 최적의 매개 변수 조합을 찾을 수 있다.
요약하다
BB평평선 돌파 전략은 부린 띠 지표에 기반한 거래 전략으로, 가격이 부린 띠를 돌파하고 하향으로 가는 기회를 포착하여 거래한다. 이 전략의 장점은 신호가 명확하고, 실행하기 쉬운 동시에 일정 위험 제어 조치가 있다는 것이다. 그러나 이 전략에는 거래 빈도가 너무 높을 수 있는, 신호 지연 등의 문제와 같은 몇 가지 제한이 있다. 따라서 실제 응용에서, 신호 확인, 스톱 손실 최적화, 변수 최적화 등의 측면에서 전략에 대한 개선을 고려하여 전략의 안정성과 수익성을 향상시킬 수 있다.
Source
Pine
Strategy parameters
Related strategies
Comment
All comments (0)
No data
- 1